Forecast
Forecast tables for 2022–2025 (December 2022)
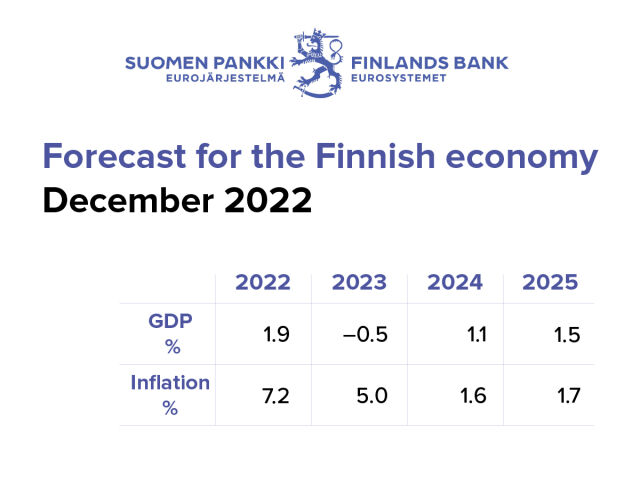
The energy crisis will push the Finnish economy into a mild recession in 2023, but this will be short-lived. Energy prices will gradually fall, and in 2024 the economy will return to growth. In the country’s public finances, spending will continue to exceed revenues.
| % change on previous year | |||||
|---|---|---|---|---|---|
| 2021 | 2022f | 2023f | 2024f | 2025f | |
| GDP at market prices | 3.0 | 1.9 | -0.5 | 1.1 | 1.5 |
| Imports of goods and services | 6.0 | 8.6 | -1.0 | 1.3 | 3.8 |
| Exports of goods and services | 5.4 | 1.7 | 1.8 | 2.8 | 3.1 |
| Private consumption | 3.7 | 2.4 | -1.3 | 0.4 | 1.1 |
| Public consumption | 2.9 | 2.7 | 0.7 | 0.6 | 0.5 |
| Private fixed investment | 4.7 | 4.7 | -2.0 | -0.1 | 1.7 |
| Public fixed investment | -11.5 | 7.2 | 2.4 | 2.5 | 14.7 |
| F=forecast. | |||||
| Sources: Bank of Finland and Statistics Finland. | |||||
| 2021 | 2022f | 2023f | 2024f | 2025f | |
|---|---|---|---|---|---|
| GDP, % change | 3.0 | 1.9 | -0.5 | 1.1 | 1.5 |
| Net exports | -0.2 | -2.7 | 1.3 | 0.7 | -0.3 |
| Domestic demand excl. inventory change | 2.9 | 3.1 | -0.8 | 0.4 | 1.6 |
| of which Consumption | 2.6 | 1.9 | -0.5 | 0.4 | 0.7 |
| Investment | 0.4 | 1.2 | -0.3 | 0.1 | 1.0 |
| Inventory change + statistical discrepancy | 0.3 | 1.5 | -1.0 | 0.0 | 0.1 |
| 1 Bank of Finland calculations. Annual growth rates using the previous year's GDP shares at current prices as weights. | |||||
| F=forecast. | |||||
| Sources: Bank of Finland and Statistics Finland. | |||||
| Index 2015 = 100, and % change on previous year | |||||
|---|---|---|---|---|---|
| 2021 | 2022f | 2023f | 2024f | 2025f | |
| GDP at market prices | 108.7 | 115.0 | 120.5 | 123.3 | 125.6 |
| 2.5 | 5.8 | 4.8 | 2.4 | 1.8 | |
| Imports of goods and services | 108.9 | 130.7 | 133.4 | 130.9 | 133.0 |
| 9.4 | 20.0 | 2.0 | -1.8 | 1.6 | |
| Exports of goods and services | 110.0 | 134.4 | 138.1 | 137.2 | 138.7 |
| 9.9 | 22.2 | 2.8 | -0.7 | 1.1 | |
| Private consumption | 105.8 | 111.6 | 117.3 | 119.4 | 121.7 |
| 1.7 | 5.5 | 5.1 | 1.8 | 1.9 | |
| Public consumption | 109.7 | 112.2 | 116.9 | 120.2 | 123.1 |
| 3.3 | 2.3 | 4.2 | 2.8 | 2.5 | |
| Private fixed investment | 113.5 | 119.2 | 123.2 | 124.8 | 127.5 |
| 2.2 | 5.0 | 3.4 | 1.3 | 2.1 | |
| Public fixed investment | 110.9 | 116.5 | 119.1 | 120.7 | 122.8 |
| 3.1 | 5.1 | 2.2 | 1.4 | 1.8 | |
| Terms of trade (goods and services) | 101.0 | 102.8 | 103.6 | 104.8 | 104.3 |
| 0.5 | 1.8 | 0.8 | 1.1 | -0.5 | |
| F=forecast. | |||||
| Sources: Bank of Finland and Statistics Finland. | |||||
| EUR million and % change on previous year | |||||
|---|---|---|---|---|---|
| 2021 | 2022f | 2023f | 2024f | 2025f | |
| GDP at market prices | 251,367 | 270,933 | 282,437 | 292,448 | 302,209 |
| 5.6 | 7.8 | 4.2 | 3.5 | 3.3 | |
| Imports of goods and services | 98,505 | 128,348 | 129,686 | 128,945 | 135,927 |
| 15.9 | 30.3 | 1.0 | -0.6 | 5.4 | |
| Total supply | 349,872 | 399,281 | 412,123 | 421,393 | 438,136 |
| 8.3 | 14.1 | 3.2 | 2.2 | 4.0 | |
| Exports of goods and services | 99,081 | 123,132 | 128,934 | 131,653 | 137,239 |
| 15.9 | 24.3 | 4.7 | 2.1 | 4.2 | |
| Consumption | 189,543 | 202,904 | 211,333 | 216,784 | 223,345 |
| 5.7 | 7.0 | 4.2 | 2.6 | 3.0 | |
| Private | 128,190 | 138,438 | 143,690 | 146,811 | 151,257 |
| 5.4 | 8.0 | 3.8 | 2.2 | 3.0 | |
| Public | 61,353 | 64,466 | 67,643 | 69,973 | 72,088 |
| 6.3 | 5.1 | 4.9 | 3.4 | 3.0 | |
| Fixed investment | 59,450 | 65,624 | 66,889 | 68,004 | 72,310 |
| 3.8 | 10.4 | 1.9 | 1.7 | 6.3 | |
| Private | 48,924 | 53,769 | 54,479 | 55,116 | 57,261 |
| 7.0 | 9.9 | 1.3 | 1.2 | 3.9 | |
| Public | 10,526 | 11,855 | 12,409 | 12,888 | 15,049 |
| -8.7 | 12.6 | 4.7 | 3.9 | 16.8 | |
| Inventory change + statistical discrepancy | 1,798 | 7,621 | 4,967 | 4,953 | 5,242 |
| % of previous year's total demand | 0.2 | 1.7 | -0.7 | -0.0 | 0.1 |
| Total demand | 349,872 | 399,281 | 412,123 | 421,393 | 438,136 |
| 8.3 | 14.1 | 3.2 | 2.2 | 4.0 | |
| Total domestic demand | 250,791 | 276,149 | 283,189 | 289,740 | 300,897 |
| 5.6 | 10.1 | 2.5 | 2.3 | 3.9 | |
| F=forecast. | |||||
| Sources: Bank of Finland and Statistics Finland. |
| % in proportion to GDP at current prices | |||||
|---|---|---|---|---|---|
| 2021 | 2022f | 2023f | 2024f | 2025f | |
| GDP at market prices | 100.0 | 100.0 | 100.0 | 100.0 | 100.0 |
| Imports of goods and services | 39.2 | 47.4 | 45.9 | 44.1 | 45.0 |
| Exports of goods and services | 39.4 | 45.4 | 45.7 | 45.0 | 45.4 |
| Consumption | 75.4 | 74.9 | 74.8 | 74.1 | 73.9 |
| Private | 51.0 | 51.1 | 50.9 | 50.2 | 50.1 |
| Public | 24.4 | 23.8 | 23.9 | 23.9 | 23.9 |
| Fixed investment | 23.7 | 24.2 | 23.7 | 23.3 | 23.9 |
| Private | 19.5 | 19.8 | 19.3 | 18.8 | 18.9 |
| Public | 4.2 | 4.4 | 4.4 | 4.4 | 5.0 |
| Inventory change + statistical discrepancy, | 0.7 | 2.8 | 1.8 | 1.7 | 1.7 |
| Total demand | 139.2 | 147.4 | 145.9 | 144.1 | 145.0 |
| Total domestic demand | 99.8 | 101.9 | 100.3 | 99.1 | 99.6 |
| F=forecast. | |||||
| Sources: Bank of Finland and Statistics Finland. |
| Index 2015 = 100, and % change on previous year | |||||
|---|---|---|---|---|---|
| 2021 | 2022f | 2023f | 2024f | 2025f | |
| Harmonised index of consumer prices, 2005=100 | 106.1 | 113.8 | 119.5 | 121.3 | 123.3 |
| 2.1 | 7.2 | 5.0 | 1.6 | 1.7 | |
| Consumer price index, 2005=100 | 105.8 | 113.4 | 119.6 | 121.6 | 123.5 |
| 2.2 | 7.1 | 5.5 | 1.7 | 1.6 | |
| Private consumption deflator | 105.8 | 111.6 | 117.3 | 119.4 | 121.7 |
| 1.7 | 5.5 | 5.1 | 1.8 | 1.9 | |
| Private investment deflator | 113.5 | 119.2 | 123.2 | 124.8 | 127.5 |
| 2.2 | 5.0 | 3.4 | 1.3 | 2.1 | |
| Exports of goods and services deflator | 110.0 | 134.4 | 138.1 | 137.2 | 138.7 |
| 9.9 | 22.2 | 2.8 | -0.7 | 1.1 | |
| Imports of goods and services deflator | 108.9 | 130.7 | 133.4 | 130.9 | 133.0 |
| 9.4 | 20.0 | 2.0 | -1.8 | 1.6 | |
| Value-added deflators | |||||
| Value-added, gross at basic prices | 108.9 | 115.5 | 121.2 | 124.0 | 126.3 |
| 2.4 | 6.1 | 4.9 | 2.4 | 1.8 | |
| F=forecast. | |||||
| Sources: Bank of Finland and Statistics Finland. |
| % change on previous year | |||||
|---|---|---|---|---|---|
| 2021 | 2022f | 2023f | 2024f | 2025f | |
| Whole economy | |||||
| Index of wage and salary earnings | 2.4 | 2.6 | 4.3 | 3.5 | 3.0 |
| Compensation per employee | 2.9 | 3.7 | 5.5 | 3.8 | 3.2 |
| Unit labour costs | 2.5 | 4.4 | 5.8 | 2.9 | 2.0 |
| Labour productivity per employed person | 0.4 | -0.7 | -0.3 | 0.9 | 1.1 |
| F=forecast. | |||||
| Sources: Bank of Finland and Statistics Finland. |
| 1,000 persons and % change on previous year | |||||
|---|---|---|---|---|---|
| 2021 | 2022f | 2023f | 2024f | 2025f | |
| Labour force survey (15–74-year-olds) | |||||
| Employed persons | 2,548 | 2,614 | 2,609 | 2,616 | 2,625 |
| 2.6 | 2.6 | -0.2 | 0.3 | 0.3 | |
| Unemployed persons | 210 | 193 | 208 | 204 | 201 |
| 1.9 | -9.0 | 7.8 | -1.7 | -1.5 | |
| Labour force | 2,759 | 2,807 | 2,817 | 2,820 | 2,826 |
| 2.5 | 1.7 | 0.3 | 0.1 | 0.2 | |
| Working-age population (15–64-year-olds) | 3,417 | 3,420 | 3,420 | 3,419 | 3,418 |
| -0.1 | 0.1 | 0.0 | -0.0 | -0.0 | |
| Labour force participation rate, % | 67 | 68 | 69 | 69 | 69 |
| Unemployment rate, % | 7.6 | 6.9 | 7.4 | 7.2 | 7.1 |
| Employment rate (15–64-year-olds), % | 72.1 | 73.7 | 73.6 | 73.8 | 74.1 |
| F=forecast. | |||||
| Sources: Bank of Finland and Statistics Finland. |
| 2021 | 2022f | 2023f | 2024f | 2025f | |
|---|---|---|---|---|---|
| % relative to GDP | |||||
| General government revenue | 52.7 | 52.5 | 52.4 | 52.2 | 51.9 |
| General government expenditure | 55.4 | 53.4 | 54.2 | 54.2 | 54.5 |
| General government primary expenditure | 54.9 | 52.8 | 53.4 | 53.3 | 53.5 |
| General government interest expenditure | 0.5 | 0.6 | 0.8 | 0.9 | 1.1 |
| General government net lending | -2.7 | -0.9 | -1.8 | -2.0 | -2.6 |
| Central government | -3.3 | -1.8 | -2.2 | -2.2 | -2.8 |
| Local government | -0.2 | -0.4 | -0.7 | -0.9 | -1.1 |
| Social security funds | 0.8 | 1.3 | 1.0 | 1.1 | 1.2 |
| General government primary balance | -2.2 | -0.4 | -1.1 | -1.1 | -1.6 |
| General government structural balance¹ | -2.0 | -1.0 | -1.5 | -1.5 | -2.3 |
| General government debt (EDP) | 72.4 | 72.2 | 71.9 | 73.2 | 74.9 |
| Central government debt | 51.2 | 52.2 | 52.3 | 53.4 | 54.7 |
| Tax ratio | 43.0 | 42.7 | 42.4 | 42.3 | 42.1 |
| Current prices, EUR billion | |||||
| General government net lending | -6.8 | -2.5 | -5.1 | -5.9 | -7.9 |
| Central government | -8.2 | -5.0 | -6.1 | -6.4 | -8.3 |
| Local government | -0.5 | -1.2 | -1.9 | -2.6 | -3.2 |
| Social security funds | 2.0 | 3.6 | 2.9 | 3.1 | 3.7 |
| General government debt (EDP) | 181.9 | 195.7 | 203.1 | 214.0 | 226.2 |
| 1Based on the cyclical adjustment method used by the European System of Central Banks. | |||||
| F=forecast. | |||||
| Sources: Bank of Finland and Statistics Finland. | |||||
| EUR billion | |||||
|---|---|---|---|---|---|
| 2021 | 2022f | 2023f | 2024f | 2025f | |
| Exports of goods and services (SNA) | 99.1 | 123.1 | 128.9 | 131.7 | 137.2 |
| Imports of goods and services (SNA) | 98.5 | 128.3 | 129.7 | 128.9 | 135.9 |
| Goods and services account (SNA) | 0.6 | -5.2 | -0.8 | 2.7 | 1.3 |
| % to GDP | 0.2 | -1.9 | -0.3 | 0.9 | 0.4 |
| Investment income and other items, net (+ statistical discrepancy) | 4.0 | -2.3 | 0.9 | 0.9 | 0.9 |
| Current transfers, net | -3.0 | -2.5 | -2.3 | -2.4 | -2.7 |
| Current account, net | 1.6 | -10.0 | -2.1 | 1.1 | -0.5 |
| Net lending, % to GDP | |||||
| Private sector | 3.3 | -2.8 | 1.2 | 2.6 | 2.5 |
| Public sector | -2.7 | -0.9 | -2.0 | -2.2 | -2.7 |
| Current account, % to GDP | 0.6 | -3.7 | -0.8 | 0.4 | -0.2 |
| F=forecast. | |||||
| Sources: Bank of Finland and Statistics Finland. |
| % | |||||
|---|---|---|---|---|---|
| 2021 | 2022f | 2023f | 2024f | 2025f | |
| 3-month Euribor1 | -0.5 | 0.4 | 2.9 | 2.7 | 2.5 |
| Yield on Finnish 10-year government bonds1 | -0.1 | 1.2 | 1.7 | 1.8 | 1.9 |
| 1Technical assumption derived from market expectations. | |||||
| F=forecast. | |||||
| Sources: Bank of Finland and Statistics Finland. | |||||
| The Eurosystem staff projections | |||||
|---|---|---|---|---|---|
| 2021 | 2022f | 2023f | 2024f | 2025f | |
| GDP, % change on previous year | |||||
| World (excl. euro area) | 6.4 | 3.3 | 2.6 | 3.1 | 3.3 |
| USA | 5.9 | 1.9 | 0.6 | 0.9 | 1.8 |
| Euro area | 5.2 | 3.4 | 0.5 | 1.9 | 1.8 |
| Japan | 1.7 | 1.5 | 1.4 | 1.3 | 1.3 |
| Imports, % change on previous year | |||||
| World (excl. euro area) | 12.6 | 5.6 | 1.9 | 3.3 | 3.3 |
| USA | 14.1 | 8.2 | -1.1 | 2.4 | 2.9 |
| Euro area | 8.2 | 7.9 | 3.1 | 3.3 | 3.4 |
| Japan | 5.1 | 7.6 | 3.3 | 2.4 | 2.4 |
| Index, 2015 = 100, and % change on previous year | |||||
| Import volume in Finnish export markets | 117.2 | 123.7 | 125.8 | 129.7 | 133.9 |
| 10.4 | 5.6 | 1.7 | 3.1 | 3.3 | |
| Export prices of Finland's trading partners, national currencies | 116.6 | 136.3 | 141.3 | 144.3 | 147.2 |
| 10.6 | 16.9 | 3.7 | 2.1 | 2.0 | |
| Export prices of Finland's trading partners, in euro | 106.6 | 128.0 | 132.4 | 135.1 | 137.8 |
| 9.9 | 20.0 | 3.4 | 2.1 | 2.0 | |
| Industrial raw materials (excl. energy), HWWA index, in US dollars | 152.9 | 162.7 | 145.2 | 146.1 | 148.2 |
| 42.1 | 6.4 | -10.8 | 0.7 | 1.4 | |
| Oil price, USD per barrel1 | 71.1 | 104.6 | 86.4 | 79.7 | 76.0 |
| 71.3 | 47.1 | -17.4 | -7.7 | -4.7 | |
| Finland's nominal exchange rate 2 | 91.4 | 93.9 | 93.6 | 93.6 | 93.6 |
| -0.7 | 2.7 | -0.3 | -0.0 | -0.0 | |
| US dollar value of one euro3 | 0.8 | 1.0 | 1.0 | 1.0 | 1.0 |
| -3.5 | 12.6 | 2.1 | 0.0 | 0.0 | |
| 1Technical assumption derived from market expectations. |
|||||
| 2 Broad nominal effective exchange rate, January – March 2015 = 100. The index rises as the currency depreciates. Assuming no changes in the exchange rate. | |||||
| 3 Assuming no changes in the exchange rate. | |||||
| F=forecast. | |||||
| Sources: Bank of Finland and Statistics Finland. | |||||
| 2021 | 2022f | 2023f | 2024f | 2025f | |
|---|---|---|---|---|---|
| GDP, % change | 3.0 | 1.9 | -0.5 | 1.1 | 1.5 |
| June 2022 | 3.5 | 1.7 | 0.5 | 1.5 | |
| Inflation (HICP), % | 2.1 | 7.2 | 5.0 | 1.6 | 1.7 |
| June 2022 | 2.1 | 5.6 | 2.4 | 1.8 | |
| Employment rate, % | 72.1 | 73.7 | 73.6 | 73.8 | 74.1 |
| June 2022 | 72.2 | 73.7 | 73.8 | 74.3 | |
| Unemployment rate, % | 7.7 | 6.9 | 7.4 | 7.2 | 7.1 |
| June 2022 | 7.6 | 6.5 | 6.5 | 6.4 | |
| Current account, % to GDP | 0.6 | -3.7 | -0.8 | 0.4 | -0.2 |
| June 2022 | 0.7 | -1.0 | -0.6 | 0.1 | |
| General government net lending, % to GDP | -2.7 | -0.9 | -1.8 | -2.0 | -2.6 |
| June 2022 | -2.6 | -1.9 | -1.8 | -1.6 | |
| General government debt (EDP), % to GDP | 72.4 | 72.2 | 71.9 | 73.2 | 74.9 |
| June 2022 | 65.8 | 64.4 | 65.4 | 66.1 |
| F=forecast. | |||||
| Sources: Bank of Finland and Statistics Finland. |