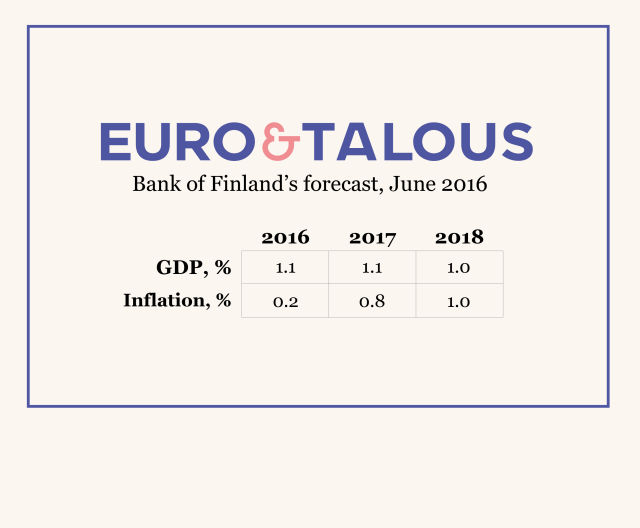
Forecast
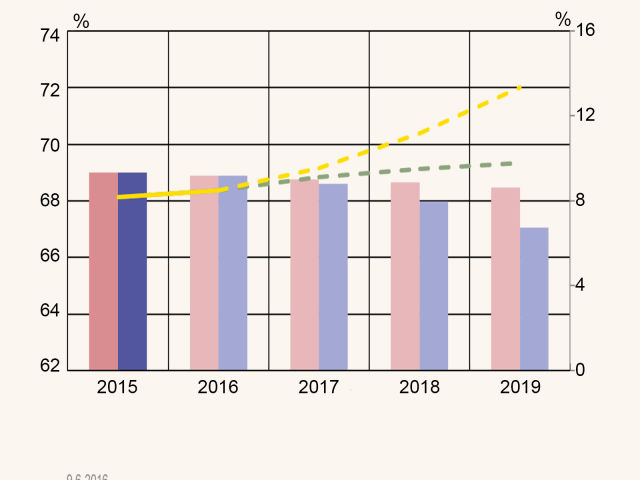
Achievement of the employment objective requires faster economic growth
One of the key objectives of the Government Programme is to raise the employment rate to 72% by the end of the parliamentary term. This means increasing the current number of people in employment by just over 100,000 by the end of 2019. If near-term economic growth is to remain around 1%, i.e. as foreseen in the baseline forecast, achievement of the objective will be unlikely. On the basis of the alternative scenario, attainment of the employment objective in the Government Programme requires markedly faster economic growth than at present. GDP growth in 2017–2019 should average 2.5% annually, i.e. about 1.3 percentage points faster than the baseline suggests, in order for the objective to be attained.
One of the key objectives of the Government Programme is to raise the employment rate to 72% by the end of the parliamentary term. This means increasing the current number of people in employment by just over 100,000 by the end of 2019. This alternative scenario presents another path than the baseline forecast and assumes an increase in economic growth so as to enable the achievement of the employment objective in the Government Programme. The scenario was produced using the Bank of Finland’s general equilibrium model (Kilponen – Ripatti – Orjasniemi – Verona 2016).
In recent years, the employment rate has remained well below the level preceding the financial crisis, and stood at 68% in 2015, i.e. even slightly lower than in the recession year 2009. Weak economic growth and the paucity of growth companies, accompanied by competitiveness problems and structural changes in the economy, have slowed the hiring of new employees in the corporate sector (Chart 1).
chart 1.The employment objective requires faster economic growth
On the basis of the alternative scenario, attainment of the employment objective in the Government Programme requires markedly faster economic growth than at present. GDP growth in 2017–2019 should average 2.5% annually, i.e. about 1.3 percentage points faster than the baseline suggests, in order for the objective to be attained. Attainment of the employment objective would require about EUR 8 billion higher real GDP in 2019 than envisaged in the baseline (Chart 2). Accomplishment of clearly faster economic growth, moreover, necessitates a significant increase in domestic and external demand.
chart 2.Hiring of employees subdued
The composition of economic growth, wage and salary development, and an increase in working time are key factors behind employment performance. In the coming years, the rate of pay increases and a higher amount of work will have a crucial impact on the price competitiveness of the economy. These factors are also key elements among measures to boost competitiveness.
The alternative scenario assumes considerably slower wage development than expected in the baseline. Technically, wage restraint is implemented by increasing labour market flexibility. Productivity is also assumed to improve faster than in the baseline forecast, which also increases work input over time. Productivity growth in the baseline forecast remains low compared with its historical trend, but in the alternative scenario it begins to return towards its long-term average. A few factors cause domestic output to grow faster than in the baseline (Chart 3). The main factors behind the growth are improved competition in the domestic market, such as greater labour market flexibility, and higher productivity.
chart 3.Decomposition of shock contribution to private output growth
As labour costs develop more moderately and productivity increases, competitiveness improves through strengthening domestic and external demand. Owing to the limited room for manoeuvre in the general government entities, public sector employment is assumed to develop in accordance with the baseline. In other words, employment growth is assumed to come entirely from the private sector. Nor does the alternative scenario make any assumption for additional stimulus affecting public expenditure, given the limited fiscal policy leeway.
The short-term elasticity foreseen in the alternative scenario between working hours and the number of 15–64-year-old employees is 0.7, which is slightly lower than by historical standards. This is, however, consistent with the fact that, at the beginning of a cyclical upturn, working hours normally increase faster than the number of employees.1
Wage restraint and longer working time reduce the price of domestic output, thereby bringing down the price of private consumption. The lower price of domestic output also feeds through, with a short lag, to export prices, which rise markedly more slowly in the alternative scenario than in the baseline forecast. The much more subdued rise in export prices than in competitor countries supports export growth. Competitiveness in terms of unit labour costs also gains strength. Higher domestic and external demand also increase imports. Against a backdrop of improved price competitiveness, net exports strengthen compared with the baseline.
Lower labour costs are also reflected in the price of investment. Investment picks up, boosted by exports and domestic demand. Investment growth also mirrors enhanced productivity, which helps improve expected returns on investment. As a consequence, the employment situation improves and unemployment begins to decline gradually.
The amelioration of the employment situation and growth of the wage bill, together with muted price development, increase households’ purchasing power and private consumption. Stronger purchasing power, in the context of the better employment situation, also reinforces households’ confidence, thus increasing their propensity to consume. Private consumption expands. This pattern is offset by the savings ratio falling even deeper into negative territory than in the baseline at the same time as the development of incomes remains slower than consumption growth.
With moderate pay development, lower prices and higher productivity growth, the alternative scenario foresees the economy adjusting to a faster growth path. Against a backdrop of more moderate price trends, however, nominal GDP remains broadly at the baseline level. Owing to subdued price performance, the state of the public finances barely improves. The alternative scenario allows for a slight reduction in tax rates, which cuts overall tax revenue, but has a positive impact on growth (cf. Chart 3). If tax rates were kept unchanged, it would strengthen the state of public finances. Public savings, however, arise from lower cyclical expenditure, such as unemployment costs. In addition, growth of index-linked expenditure, e.g. pensions, slows on the back of more moderate price dynamics.
The structures of the economy and external demand ultimately determine the composition of growth that would enable achievement of the objective of a 72% employment rate. The alternative scenario also assumes that the employment situation will improve through the contribution of both demand and supply factors. Productivity can be influenced only indirectly. Adjustment via cost factors and prices then remains a key option. The objective of a 72% employment rate is challenging, but by international standards it is lower than in the best-performing countries. For example, employment rates in Sweden and Germany are much higher.
Table.
| 72% employment objective | ||||||
| Souce: Bank of Finland calculations. | ||||||
| Supply and demand in 2016–2019 at 2010 prices | ||||||
| 2016 | 2017 | 2018 | 2019 | 2019 deviation, % |
||
| % change on previous year | ||||||
| GDP | Baseline forecast | 1.1 | 1.1 | 1.0 | 1.4 | 196,245 |
| Alternative scenario | 1.1 | 1.7 | 2.5 | 3.4 | 204,312 | |
| Difference | 0.0 | 0.6 | 1.5 | 2.0 | 4.1 | |
| Imports | Baseline forecast | 2.7 | 2.5 | 2.0 | 1.8 | 82,598 |
| Alternative scenario | 2.7 | 3.0 | 2.8 | 2.6 | 84,265 | |
| Difference | 0.0 | 0.5 | 0.7 | 0.8 | 2.0 | |
| Exports | Baseline forecast | 0.7 | 2.4 | 2.5 | 2.8 | 81,809 |
| Alternative scenario | 0.7 | 3.1 | 4.1 | 5.0 | 85,440 | |
| Difference | 0.0 | 0.7 | 1.7 | 2.2 | 4.4 | |
| Private consumption | Baseline forecast | 1.6 | 0.6 | 0.7 | 1.2 | 108,799 |
| Alternative scenario | 1.6 | 1.6 | 2.2 | 2.7 | 113,029 | |
| Difference | 0.0 | 0.9 | 1.5 | 1.5 | 3.9 | |
| Private investment | Baseline forecast | 4.7 | 3.6 | 2.6 | 2.3 | 34,879 |
| Alternative scenario | 4.7 | 3.8 | 4.3 | 6.0 | 36,827 | |
| Difference | 0.0 | 0.2 | 1.7 | 3.7 | 5.6 | |
| Private sector output price | Baseline forecast | 0.6 | 0.5 | 0.8 | 1.1 | 112.3 |
| Alternative scenario | 0.6 | 0.1 | -1.1 | -1.4 | 107.0 | |
| Difference | 0.0 | -0.4 | -1.9 | -2.5 | -4.7 | |
| General government net lending | Baseline forecast | -2.6 | -2.4 | -2.3 | -2.3 | -2.3 |
| Alternative scenario | -2.6 | -2.4 | -2.4 | -2.3 | -2.3 | |
| Difference | 0.0 | 0.0 | -0.1 | 0.0 | 0.0 | |
| Unit labour costs | Baseline forecast | 1.5 | 0.4 | 0.8 | 1.3 | 0.6 |
| Alternative scenario | 1.5 | -0.1 | -1.2 | -1.4 | 0.6 | |
| Difference | 0.0 | -0.5 | -2.0 | -2.6 | -5.0 | |
| Employed, aged 15–64 | Baseline forecast | 0.0 | 0.3 | 0.2 | 0.1 | 2,384 |
| Alternative scenario | 0.0 | 0.8 | 1.5 | 2.1 | 2,476 | |
| Difference | 0.0 | 0.5 | 1.3 | 2.0 | 3.8 | |
Notes
-
Data on work input are based on Statistics Finland's Labour Force Survey. ↑