Analysis
Demographic change reduces labour force and number of employed

Meri Obstbaum
Adviser to the BoardSince the financial crisis, the population structure and age structure of the Finnish labour force have changed as the baby boomer cohorts retire. As well as capital formation and productivity, labour input constitutes one of the pillars of economic growth, meaning that the contraction of the working-age population directly cuts the growth rate of potential output. What is the scale of this problem? Further, how has the situation already been reflected on the Finnish labour market, and what implications will it have over the next five years?

Labour force participation rate declines as population ages
Demographic change can be reviewed via two important labour market variables – the employment rate and the labour force participation rate (LFPR). They indicate how large a share of the working-age population is in employment and generates value added for the economy or actively seeks work. Raising the employment rate improves the economic dependency ratio and is thus a key prerequisite for the financing of a modern welfare state.
An examination of the LFPR shows that the total number of employed and unemployed persons relative to the same-age population varies considerably at different ages and that LFPRs have also clearly changed in 1989–2015 (Chart 1). A striking change is that the LFPR for 55–64-year-olds has risen strongly. During the years under review, the average educational level of people aged 55–64 has improved, and changes in, for example, work incentives and health may also have had an impact on increased labour force participation.
Other shifts in LFPRs have also been seen since the turn of the millennium. The LFPR for those aged over 65 has increased markedly from its previous very modest level, and the LFPR for young adults (25–34-year-olds) has decreased since the financial crisis. Labour force participation by the youngest age group varies according to the business cycle more than in the case of other age groups (Chart 1).
chart 1.Demographic change weakened LFPR by over 2 percentage points
If we look at how demographic shifts have affected the average LFPR for 15–74-year-olds, we find that the LFPR has decreased by 2 percentage points in seven years (Chart 2). The red unbroken line depicts the actual post-2008 LFPR.
chart 2.Demographic changes will actually raise the employment rate in the immediate years ahead
The impact of population ageing on the weakening trend in the LFPR can be illustrated by examining what the average LFPR would have been if age-group-specific LFPRs had remained the same as in 2008 (the red dash line in Chart 2). Population shares have, however, changed. Consequently, a mere shift in population shares, i.e. the composition of the labour force, has lowered the LFPR by 2.4 percentage points since 2008. The main reason for the weakening is the strong growth in the share of those aged over 65 in the working-age population, an age group whose LFPR is very low compared with other age groups. Another factor contributing to the deterioration of the LFPR is, however, that the share of age groups with the highest LFPRs has diminished.
A comparison between the actual LFPR and the LFPR illustrating the mere impact of demographic change indicates that the LFPR declined immediately after the financial crisis by more than it could have been expected to decline on the basis of demographic shifts alone. This was naturally due, in part, to the worsening employment situation in the double-dip recession following the financial crisis and to the fact that some job applicants exited the labour market to await better times.
One interesting finding is that, despite the double-dip recession, the average LFPR would actually have risen in Finland after the financial crisis if the age structure of the population had not become unfavourable (Chart 2). Upon examination of the outcome for the average LFPR, if population shares had remained the same as in 2008 but age-group-specific LFPRs had changed (the blue line in Chart 2), we find that the LFPR, calculated in this manner, would have been higher in 2015 than in 2008. Accordingly, labour supply would have increased slightly, on average, despite the weak performance of the economy.1 This has been possible because labour force participation in age groups over 45 has increased more strongly than the decrease in the LFPR in age groups under 45. The LFPR for those at ages 55–64 has improved most, whereas the LFPR for those at ages 25–34 has declined most. Hence, more active labour force participation by over-45-year-olds has in part compensated for the negative contribution to the average LFPR from demographic change. Even so, the increase in age-group-specific LFPRs has only had a small positive effect, as the decline in the actual LFPR has been almost as strong as the contribution from demographic change.
What will the situation look like in the light of Statistics Finland’s population projections five years hence, i.e. in 2016–2020 (Chart 3)? Our analysis shows that the downward impact on the LFPR from population ageing will continue over the next five years (the red dash line in Chart 3). Even if age-group-specific LFPRs were to remain the same as in 2015, demographic shifts would lower the LFPR by another 0.7 of a percentage point in the next few years. Accordingly, going forward, the negative contribution to the LFPR from demographic change will level off, having peaked in 2011–2013.
chart 3.Population structure depressed employment rate prior to financial crisis
The calculations presented here, in terms of labour force size, mean that in 2008–2015 mere demographic shifts would have downsized the labour force (15–74-year-olds) by about 33,000 persons. However, the actual contraction in the labour force was only 15,000, as labour force participation by elderly employees increased strongly. A calculation by age group shows how mere changes in population shares would have affected the size of the labour force in each age group, what the actual change in the labour force size was and, in addition, how demographic shifts will impact the labour supply of each age group over the next five years if there is no change in age-group-specific LFPRs (Table 1). The actual outcome vis-à-vis the calculation is particularly poor for 25–34-year-olds and surprisingly good for 55–64-year-olds.
Table 1.
|
Sources: Statistics Finland and calculations by the Bank of Finland. |
|||
|
Impact of demographic change on labour force by age group |
|||
| Labour force | |||
| Age group |
Calculation |
Actual 2008–2015 |
Calculation 2016–2020 |
| 15–24 | –8 | –15 | –19 |
| 25–34 | 26 | 1 | 10 |
| 35–44 | –25 | –40 | 45 |
| 45–54 | –26 | –25 | –54 |
| 55–64 | –11 | 30 | –11 |
| 65–74 | 12 | 35 | 11 |
| 15–64 | –44 | –50 | –28 |
| 15–74 | –33 | –15 | –18 |
Demographic shift will no longer depress employment rate
Crucial for the economic dependency ratio is, at the end of the day, how much of the population as a whole is in employment generating added value. The employment rate is, in fact, the indicator to which economic policy objectives are, in general, justifiably linked. The Finnish Government’s objective is to achieve a 72% employment rate. As the employment rate is, however, officially calculated on the basis of a working-age population of 15–64-year-olds, population ageing barely has an impact on the employment rate via retirement. Other shifts in population shares could, of course, have structural effects that could cause the employment rate to change.
The population structure has had no implications at all for the official employment rate in 2008–2015, and over the next five years demographic changes will even slightly improve the employment rate (Chart 4). This becomes apparent in an analysis in which employment rates by age group are fixed at the year 2008, but population shares change (the red dash line in Chart 4). A more retrospective review shows that the population structure weakened the employment rate, in structural terms, in the early years of the new millennium, when the baby-boomers were in the age group 55–64, whose employment rate was well below the average. In the absence of demographic shifts, the employment rate prior to the financial crisis would already have risen well above 72%, i.e. the downward impact of population structure on the employment rate was about 2 percentage points.
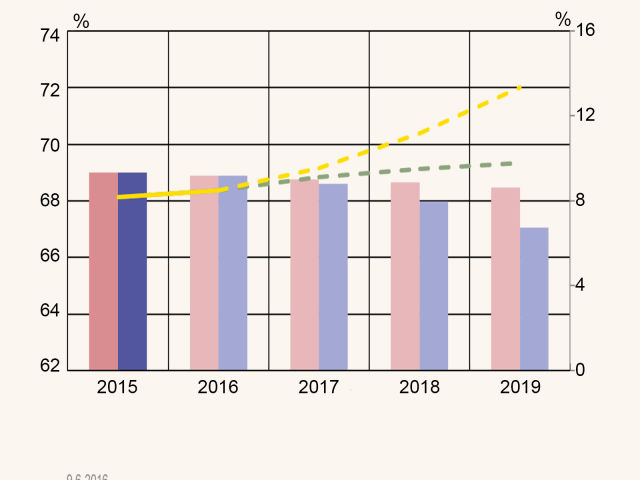
chart 4.Demographic changes will actually raise the employment rate in the immediate years ahead
If we look at what the average employment rate would be if population shares had remained the same as in 2008, but employment rates by age group had changed (the blue line in Chart 4), we find no significant deviation from the actual employment rate (the red unbroken line). This reflects the fact that the weakening of the average employment rate derives from factors other than demographic change. The causes must be sought from the business cycle and incentives for work. A closer examination shows that the employment rate deteriorated in 2008–2015 in all age groups other than among 55–64-year-olds, whose employment rate improved by 3.5 percentage points, despite the fragile economic situation. The trend was particularly strong among those aged 25–34, whose employment rate fell by as much as 6.3 percentage points. The contraction of the employment rate following the financial crisis has been a genuine deterioration in the sense that demographic change had no impact on it.
Nonetheless, demographic shifts have affected the number of employed persons. As the share of those aged 15–64 in the population contracts (the denominator of the employment rate), even the fact that the employment rate remains unchanged means a reduction in the number of employed persons (the numerator of the employment rate). Meanwhile, the diminishing number of employed persons impairs the economic dependency ratio. This should be taken into account in setting employment targets.
The following calculation illustrates how much a mere shift in population shares would have reduced the number of employed persons among different age groups in 2008–2015 and what the actual change in the number of employed persons in each age group is (Table 2). As in the examination conducted via the LFPR, the age group of 25–34-year-olds stands out, as its actual employment performance is particularly weak. The last column of the table indicates how much demographic change will affect the number of employed persons among different age groups during the next five years.Even if, in structural terms, demographic shifts even slightly improve the employment rate in the immediate years ahead, it still means downward pressure on the number of employed persons.
Table 2.
|
Sources: Statistics Finland and calculations by the Bank of Finland. |
|||
|
Impact of demographic change on the number of employed by age group |
|||
| Age group |
Calculation |
Actual 2008–2015 |
Calculation 2016–2020 |
| 15–24 | –6 | –32 | –14 |
| 25–34 | 25 | –19 | 9 |
| 35–44 | –24 | –53 | 42 |
| 45–54 | –25 | –41 | –50 |
| 55–64 | –11 | 15 | –10 |
| 65–74 | 11 | 35 | 11 |
| 15–64 | –42 | –130 | –24 |
| 15–74 | –30 | –94 | –13 |
For a long time already, the population structure has been eroding the LFPR, and the negative contribution has been highlighted during the years since the financial crisis, which have seen the baby-boomers entering retirement (Chart 5). As for the employment rate, it was depressed by the population structure in the first years of the new millennium, but no longer since the financial crisis (Chart 6). Accordingly, the post-crisis deterioration in the employment rate must be considered genuine, and causes for this development must be sought, besides cyclical factors, in incentives for work, among other factors. Over the next five years, the population structure will still lower the LFPR, if not by as much as in recent years. Demographic change could actually improve the employment rate in the near term, while still reducing the number of employed persons.
chart 5.Demographic change weakened LFPR by over 2 percentage points
chart 6.Negative contribution from demographic change will level off going forward
Notes
-
See also Bank of Finland Bulletin 3/2013. ↑