Article content
Analysis
Assessing transition risks in banks’ corporate loan portfolios
Climate change is forcing the economy to transit towards a more sustainable future. Transition risks are related to the process of adjustment to a low-carbon economy. Granular data are needed to analyse the transition risks. Transition risks have economy-wide impacts via business links, and a comprehensive picture requires going beyond firms’ own emissions. The transition towards net-zero will need large investments. Based on future investment needs, it is expected that there will be a material increase in the demand for bank loans and other financing.
 The opinions expressed in this paper are those of the authors and do not necessarily reflect the views of the Bank of Finland.
Transition risks result from a shift towards a net-zero economy
Climate change is forcing the economy to transit towards a more sustainable future. Businesses and industries therefore need to modify their production models. Firms face the risk of decreasing demand for high carbon-intensive products and increasing costs if prices of carbon-intensive intermediate products soar. If these risks materialise, high emitting businesses could incur losses. This also poses risks to banks that have been financing these firms.
One approach to assess transition risk is to measure financed Financed emissions are defined here as (Loans/Total assets)*Total emissions, where loans are lending by bank to emitting firm, total assets are balance sheet total of emitting firm and total emissions are emissions by emitting firm. Green House Gas (GHG) emissions and/or emissions intensities of financial institutions’ assets such as corporate loans. More financed emissions indicate higher risk and a greater need to adjust the loan portfolio towards less carbon-intensive and/or more sustainable firms. Debtors’ emissions are not, however, a sufficient indicator of transition risk alone, given the multiple drivers and transmission channels of transition risks, for example businesses’ capability to absorb the increased costs or decreased demand as well as technological change and innovation.
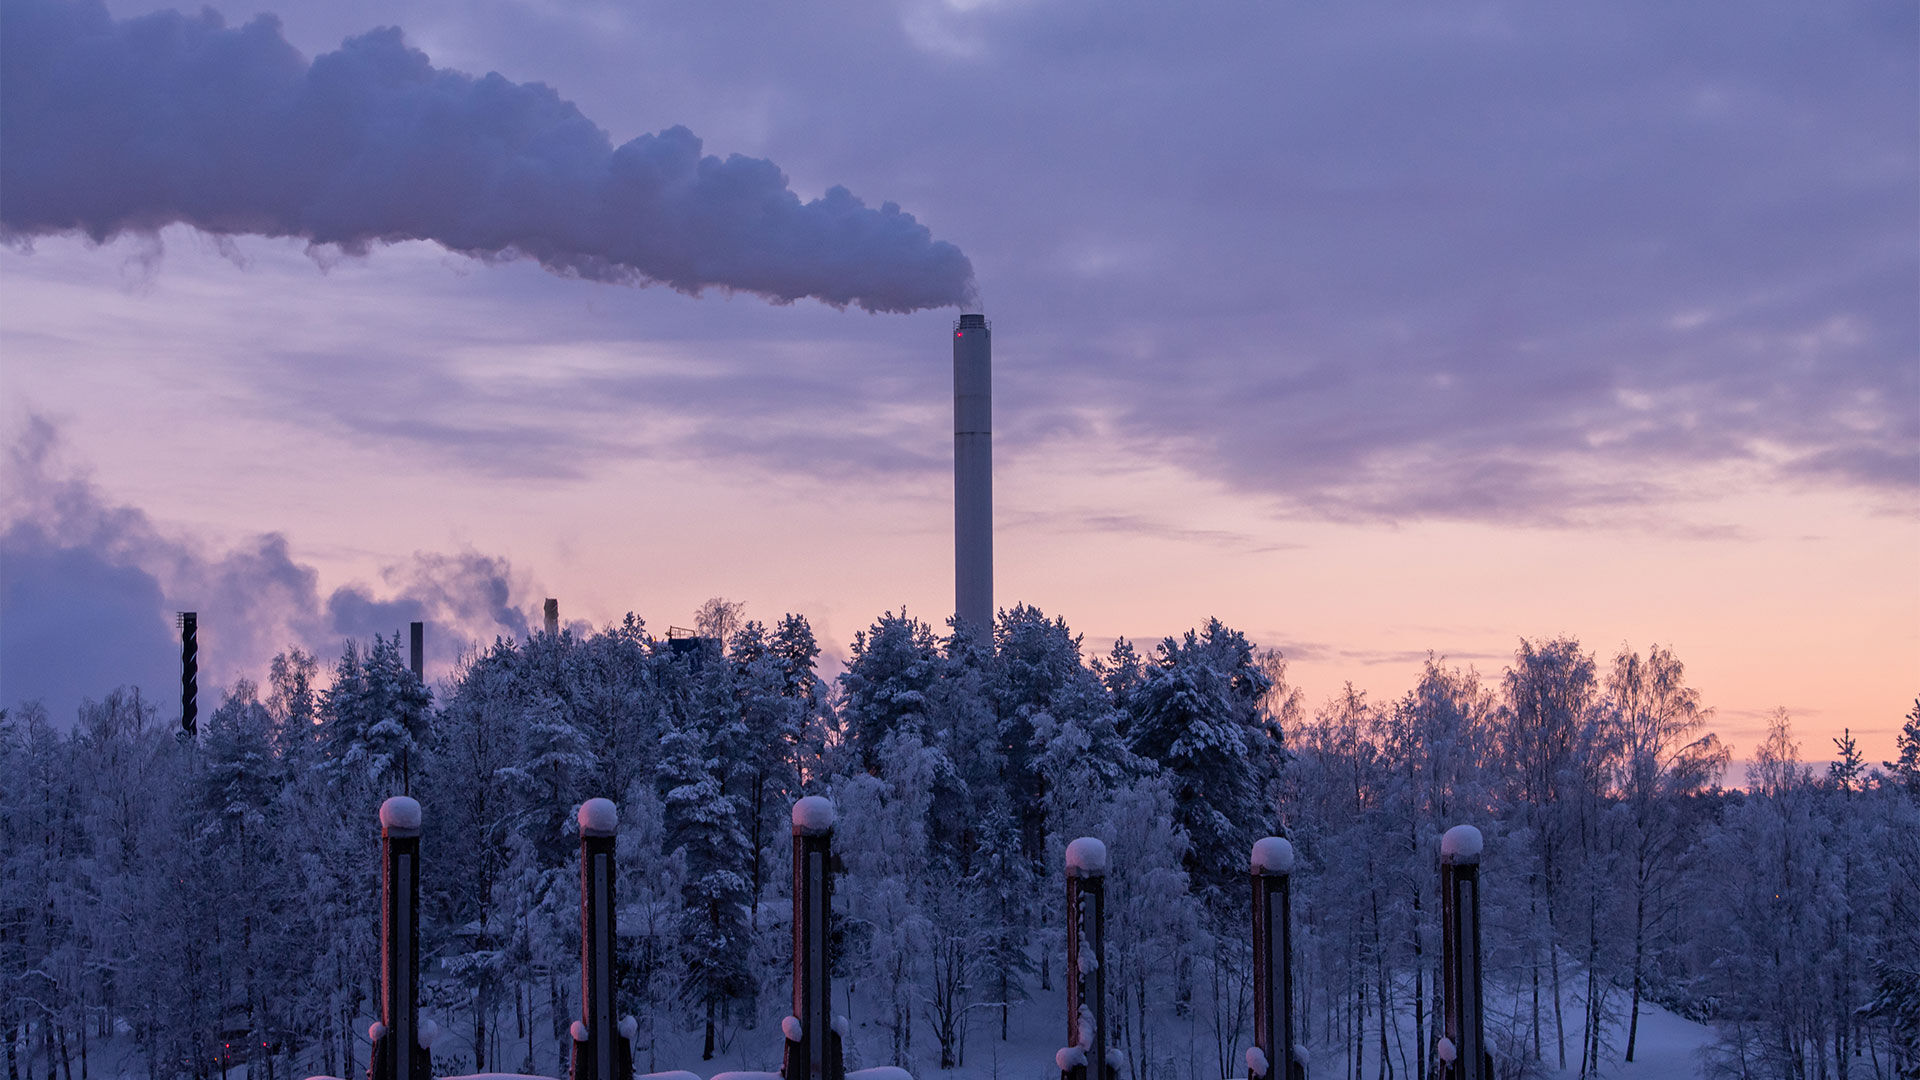
In terms of transition risks, the energy sector is a case in point. Energy can be produced with zero or high carbon emissions. Energy producers are looking for ways to replace high carbon emission facilities with more sustainable modes of production. Chapter 1 focuses particularly on the carbon content of bank loans to the energy sector.
Carbon exposure can be measured with Scope 1, 2 and 3 emissions, as defined by the Greenhouse Gas (GHG) Protocol Greenhouse Gas Protocol https://ghgprotocol.org/.: Scope 1 covers direct carbon emissions from sources that are owned or controlled by the reporting entity, for example emissions from its own physical or chemical processing and owned vehicles. Scope 2 covers carbon emissions from consumption of purchased electricity, heat, steam or cooling. Finally, Scope 3 is the broadest measure as it covers indirect emissions that occur in the value chain of a reporting company. Scope 3 emissions are a consequence of the activities of the reporting entity but occur at sources owned or controlled by another entity (not covered in Scope 2). For example, emissions resulting from production or extraction of purchased materials and waste disposal are included in Scope 3. Chapter 2 analyses transition risks in supply chains.
Energy industry is a high emitter, but bank loans are not concentrated in the highest emitters
The main benefit of the granular approach presented in this article is to be able to distinguish to what extent financing is allocated to firms with a large share of total emissions and to firms that emit less. The energy industry is a suitable starting point for more granular analysis as it has a large share of the firms’ loan stock and aggregate emissions.
Comparing granular analysis to aggregate- or industry-level analysis, it is particularly important to examine the data at corporate group level. In corporate groups (particularly in the energy industry) the same entities do not necessarily produce the emissions and acquire the financing from banks. Therefore, in the following analysis, the emissions and loans are aggregated from single entity level to domestic corporate group level using Statistics Finland's Enterprise Group Register. If a firm is not part of any corporate group according to Enterprise Group Register, the firm is included as one unit.
There were roughly two hundred corporate groups whose principal economic activity was within the energy industry in 2020 and were financed by Finnish banks. Only 19% of the corporate groups were private corporate groups. In other cases, the corporate groups were municipal corporate groups or state-owned corporate groups. In addition, there were 224 individual firms whose principal economic activity was within the energy industry but were not part of a corporate group. In total, the loan stock of these entities was EUR 7.4 billion and direct emissions totalled 8.0 billion grams of GHG in CO2 equivalent.
The 25 largest emitters accounted for 95% of direct emissions but accounted only for 45% of the total loan stock of corporate groups and individual units within the energy industry in 2020. At the same time, the 25 largest debtors accounted for 77% of the loan stock but accounted only for 40% of total emissions. This shows that a large share of the loans is channeled to corporate groups producing energy from renewable energy sources or zero carbon emission sources, i.e. wind, hydroelectric or nuclear power. Also Räsänen and Kauko (2022) found that in 2020, Finnish MFIs clearly funded more renewable energy sources than the share of these forms of energy production in the European Union The analysis was based on loan data from Finnish MFIs as well as data on emissions and technologies from PACTA, which are company-specific. The loans of Finnish MFIs to enterprises and other entities have been obtained from the Luoti data collection that represents the Finnish implementation of the Eurosystem's AnaCredit database.. Although the forward-looking scenario-analysis concluded that transition risk of the Finnish MFIs is limited, the share of renewable energy in the corporate loans stock was not at a sustainable level in the projection to year 2025.
The granular approach also enables a closer examination of the creditors' side, for example whether some banks concentrate on financing more or less emission-intensive energy sources. Overall, 91 banks had granted loans to the domestic energy sector at the end of 2020. Of these, 18 banks in total had granted loans to the top 25 emitter corporate groups. The median share of these top 25 emitter groups of all energy sector loans was 57% (equaling EUR 36 million). The upper and lower quartiles were 69% and 39%. This means that five banks had granted over two-thirds of their energy sector loans to these top 25 emitters. Nevertheless, we are missing an important piece of the puzzle: we do not know the purpose of these loans. Loans might be directed to make businesses greener, i.e. to finance the transition. Therefore, these would not be as harmful as other loans. More forward-looking indicators, such as firms’ annual emission targets, would provide valuable information on this aspect. Based on investment need estimates (see more in chapter 3) we can also expect that businesses with older production facilities might need more financing for transition in the near future.
Assessing transition risks in supply chains captures indirect risks
To analyse the transition risks of bank lending, the use of relative indicators such as carbon intensities and carbon footprints are more feasible than absolute indicators (total and financed emissions of debtors). Carbon intensity measures carbon efficiency by comparing emissions financed with the emitter’s revenue. Carbon footprint Carbon footprint is defined here based on Task Force on Climate-Related Financial Disclosures (TCFD) recommendations: https://www.tcfdhub.org/Downloads/pdfs/E09%20-%20Carbon%20footprinting%20-%20metrics.pdf is defined as financed emissions divided by outstanding loans to emitters Within this article emitters include debtors in non-finacial corporations sector (S11) with turnover>0, loans>0, balance sheet total>0 and 100*turnover>loans and emissions=0 or >0. Loan data is acquired from (Luoti) the domestic versions of ESCB AnaCredit. Regarding emissions data the data sources are Emission Trading System (ETS) data and Statistics Finland’s Air Emission Accounts.. Here carbon footprint is used to understand the transition risk in firms’ supply chains. A Scope 1 measure of carbon footprint is not sufficient alone. A Scope 1 measure highlights industries and firms that have direct GHG emissions. Nevertheless, there are industries and firms that do not have direct emissions but are highly dependent on energy or other intermediate products that have high emissions. This exposure can be measured using Scope 2 and Scope 3 emissions. The sources and methods for measuring the Scope 1, 2 and 3 emissions of debtors are based on use of the input-output framework from national accounts. The methodology for Scope 2 emissions is presented in more depth at the IMF 9th statistical forum 2021 by Ville Tolkki (Bank of Finland), with Antti Hirvonen and Anu Karhu, Carbon Footprint of Bank Loans to Domestic Non-Financial Corporations: https://www.imf.org/en/News/Seminars/Conferences/2021/11/17/9th-statistical-forum-measuring-climate-change. Calculation methods are largely in line with the PCAF Standard on the Global GHG Accounting and Reporting for the Financial Industry, and the TCFD Annex on Implementing the Recommendations of the Task Force on Climate-related Financial Disclosures (October 2021)
The Global GHG Accounting and Reporting Standard for the Financial Industry (carbonaccountingfinancials.com) 2021-TCFD-Implementing_Guidance.pdf (bbhub.io)
Chart 2 shows how the exposure to transition risk varies according to different measures of emissions (Scopes 1 – 3). The indicator levels should not be compared, because Scopes 1 – 3 measure different aspects. Also, Scopes 1 – 3 demand different mitigation strategies from firms. Banks’ lending to primary production, energy and transport has high transition risk content when looking at Scope 1 measure. Indirect risk exposures (Scope 2 and Scope 3) appear to be highest for lending to transport, construction, manufacturing and primary production. Moreover, while trade is not highlighted by Scope 1 metrics, it is above average based on Scope 2 emissions.
Scope 2 emissions only include the use of the energy industry’s intermediate outputs. Therefore, Scope 3 measures should also be developed. The construction industry, for example, uses a lot of intermediate products from metal, mineral and pulp producing industries, which are also high GHG emitters. Chart 1 also shows experimental results on Scope 3 domestic upstream emissions based on the same methodology as for Scope 2 emissions. These calculations appear to confirm the expectations that the construction industry is dependent on high carbon-intensive intermediate products (other than energy) and thus rates above average in Scope 3 upstream emissions.
Should loan stock decarbonising keep pace with national targets while financing the transition?
To put the domestic carbon emissions of the domestic corporate loan stock of Finnish banks into a larger context, it is useful to view them against national climate goals (Chart 3). According to the Government Programme and the Climate Change Act (2022), Finland should be carbon neutral by the year 2035,https://valtioneuvosto.fi/en/marin/government-programme/carbon-neutral-finland-that-protects-biodiversity. which means that carbon should not be emitted more than the carbon sinks will be able to absorb. Carbon sinks are systems that absorb more carbon than they emit, and in greenhouse gas inventory statistics, these are included in the Land use, land use changes and forestry (LULUCF) sector (net sink) Land use, land use changes and forestry (LULUCF) sector consist of emission categories of forest land, cropland, grassland, wetlands, settlements, harvested wood products, and indirect N20 emissions. Statistics Finland, Greenhouse gas emissions in Finland, 1990-2021*, https://pxdata.stat.fi/PXWeb/pxweb/en/StatFin/StatFin__khki/statfin_khki_pxt_138v.px..
According to greenhouse gas statistics Statistics Finland, Greenhouse gases, https://stat.fi/en/statistics/khki., the total greenhouse gas emissions were 47.8 million tonnes of carbon dioxide (CO2 eq.) in Finland without the LULUCF sector in 2020, including all seven greenhouse gases. This amount needs to be reduced significantly to 21 million tonnes (i.e. reduced by 70% compared to 1990, and 56% compared to 2020) by 2035 in order to emit a net zero amount of CO2 eq.
The level of emissions, 21 million tonnes, is based on the proposed target for the LULUCF net sink (-21 million tonnes of CO2 eq. in 2035) in the Climate Change Act by the Finnish Climate Change Panel https://www.ilmastopaneeli.fi/en/. in January 2021 Suomen Ilmastopaneeli, Ilmastolakiin kirjattavat pitkän aikavälin päästö- ja nielutavoitteet – Ilmastopaneelin analyysi ja suositukset, https://www.ilmastopaneeli.fi/wp-content/uploads/2021/02/ilmastopaneelin-raportti_ilmastolain-suositukset_final.pdf.. Also, the emission reduction target compared to 1990 (-70%) is proposed by the Panel. GHG emissions from Finland were 71.3 million tonnes of CO2 eq. without the LULUCF sector in 1990, and the LULUCF net sink was -25.9 million tonnes of CO2 eq. Statistics Finland, Greenhouse gases, https://stat.fi/julkaisu/cktlf0i203azm0a519to5exzc..
According to the estimation, domestic firms that have loans from domestic banks emitted a significant share of the total Scope 1 GHG emissions, i.e. 63% and 29.0 million tonnes of CO2 eq. in 2020. If the reduction of these GHG emissions from 2019 onwards would be linear with the proposed national GHG emissions targets of Finland for 2030 and 2035, the domestic corporate loan debtors should emit 14.5 million tonnes of CO2 eq. at most in 2035.
Banks’ lending (EUR 56 billion) to companies included in the calculations correspond to 10% of their balance sheet total (EUR 580 billion). The financed emissions were therefore approximately 5.3 million tonnes of CO2 eq. in 2020. Similarly, the financed emissions of the firms would be reduced to 2.6 million tonnes of CO2 eq. by 2035, if developing in line with the proposed national GHG emission targets of Finland.
The role of banks is important in decarbonising the economy in a bank-centric financial system. Firms need to finance their transition investments towards less emitting technologies and production models. We might expect to see increased demand for finance by those businesses that have not yet succeeded in reducing their emissions. For example, the case of the energy industry shows that a large share of financing has already been allocated to producers of renewable energy technologies or zero carbon emission technologies, i.e. wind, hydroelectric or nuclear power.
Large investment needs in comparison with the domestic corporate loan stock
The national goal of carbon neutrality by 2035 means that greenhouse gas emissions, which were 47.8 million tonnes of CO2 eq. in Finland in 2020, would be reduced to 21 million tonnes by 2035. The green transition has a big impact on different industries that need investments and finance to develop new technologies and production models to reach the emission targets.
The recent national HIISI report Hiilineutraali Suomi 2035 – ilmasto- ja energiapolitiikan toimet ja vaikutukset (HIISI) : Synteesiraportti – Johtopäätökset ja suositukset, Valtioneuvoston selvitys. ja tutkimustoiminnan julkaisusarja 2021:62, http://urn.fi/URN:ISBN:978-952-383-257-2. (i.e. Carbon neutral Finland 2035 – actions and implications of climate and energy policy: Synthesis report – Conclusions and recommendations) presents two different GHG emission scenarios: the WEM (With Existing Measures) and the WAM (With Additional Measures). However, only the WAM scenario reaches carbon neutrality by 2035 and therefore it is chosen as the point of interest here. According to the WAM scenario, the GHG emissions of Finland could decrease from 49 million tonnes of CO2 eq. in 2020 to 21 million tonnes by 2035, and to 5 million tonnes by 2050.
The HIISI report mentions that under the WAM scenario the reduction of emissions in the emission trading sectors is largely assumed to be carried out on market terms with no new national measures/regulations included. For example, investments in hydrogen reduction of steel manufacturing are expected to take place by 2035 and by 2040. Also, investments in carbon capture and storage (CCS) in mineral oil production as well as in hydrogen production from renewable energy sources by 2035–2040 are assumed to be made.
Energy system investments, which would be largely targeted to manufacturing, are assumed to be (according to the TIMES-VTT modelling) around EUR 37 billion (on average EUR 7.4 billion per year) in the WAM scenario between 2026–2030 and around EUR 51 billion (on average EUR 10.2 billion per year) between 2031 and 2035.
To scale the investment need for reaching carbon neutrality by 2035, the required amounts are compared with the corporate loan stock and new loan drawdowns by industries focusing on energy and manufacturing. As can be seen in Table 1, the average annual loan drawdowns (EUR 5.4 billion) of domestic corporations in manufacturing (C) and energy (D) between 2011 and 2021 has been lower than the estimated annual investment need. It must be noted, however, that other forms of finance than bank loans (for example corporate bonds and equity) are excluded from the comparison. Therefore, the investment need is naturally larger in comparison with the average loan drawdowns over the last years.
Table 1.
| Average annual corporate loan stock (from the end of December) and new drawdowns by industries C and D between 2011 and 2021 in comparison with the estimated annual investment need for carbon neutrality 2035. | |||||||
| Source: MFI (Monetary Financial Institutions) statistics by Bank of Finland and the HIISI report (Carbon neutral Finland 2035 – actions and implications of climate and energy policy (HIISI): Synthesis report – Conclusions and recommendations, Publications of the Government´s analysis, assessment, and research activities 2021:62). | |||||||
| Estimated annual investment need 2026–2035 |
Average annual loan stock 2011–2021 (NACE) |
Average annual loan drawdowns 2011–2021 (NACE) |
|||||
| EUR billion | Total (C+D) | Manu-facturing (C) | Electricity, gas, steam, and air condition-ing (D) | Total (C+D) | Manu-facturing (C) | Electricity, gas, steam, and air condition-ing (D) | Total (C+D) |
| 7.1–10.2 | 8.3 | 5.2 | 13.6 | 4.0 | 1.6 | 5.6 | |
According to the HIISI report, the dependence on large investments of the energy, manufacturing and infrastructure sectors is one of the weaknesses of the Finnish carbon neutrality target. For example, if some of the investments do not materialise, it would represent a significant additional challenge to reduce GHG emissions in other sectors and/or by strengthening the net sinks of the LULUCF sector.
The uncertainties related to the implementation of international climate policies (of the EU and the UN) is mentioned as a threat to the carbon neutrality target. A favourable investment environment is needed for the major investments to take place. Moreover, the role of banks is important in providing investment-friendly financing conditions. Despite the weaknesses and threats related to the large investment needs, the climate neutrality target might also create new economic opportunities and enhance the economy, according to the HIISI report. For example, there might be new export opportunities and improved competitiveness.
International and future development of indicators
A new ECB publication presents analysis based on comparable euro area data (link). The ECB publication covers indicators on physical risk, transition risk and green financing. The methodology used for transition risk by the ECB is comparable with that used in this article, but slight differences are due to different data sources, for example. This article uses business register data from Statistics Finland and the ECB paper uses Orbis from Bureau van Dijk.
This article and the ECB publication present the first versions of indicators on climate change and financing using ESCB statistics. There are still important avenues for work to improve the quality and feasibility of these indicators. For example, carbon offsets and forward-looking indicators are not covered. There is also room for improvement on measurement methodology work.