Forecast
Finland’s economic boom over
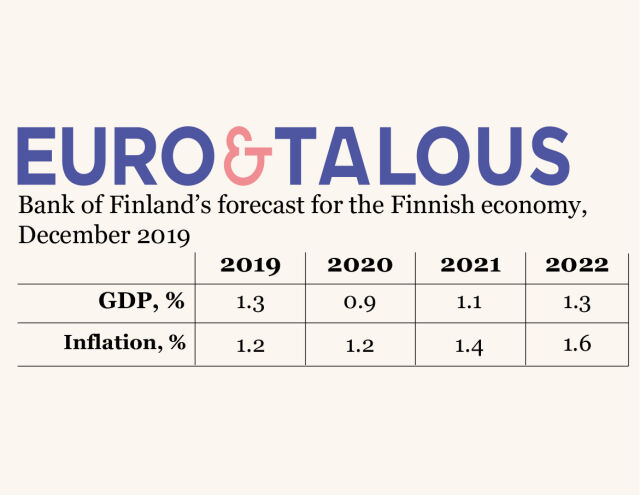
The peak of the cycle in the Finnish economy is now over and economic growth is temporarily losing momentum. Although growth for the current year is still good, there are clear signs of a slowdown. Growth has already slowed in Finland’s important trading partners, and in the domestic economy both business and household confidence has been declining for some time. The continued sluggishness of global and euro area growth is reflected in Finland’s growth figures, which will dip below 1% annual growth in 2020. However, both the euro area and the global economy will gradually recover and exert a pull on the Finnish economy, too. GDP growth will pick up slightly in 2021–2022, to 1.1% and 1.3%, respectively.

The continued uncertainty in the international economy and globally weak investment will depress the exports and investments of Finnish companies. In 2020, export growth will be sluggish and there will be little in the way of investment. Investments will also be restrained by the turn that has already occurred in housing construction, as a result of which housing investment will decline in the immediate years ahead. In the years covered by the forecast, Finland’s export demand will begin to strengthen, but actual exports from Finland, which are strongly weighted towards capital goods and intermediate goods, will join in the positive developments only towards the end of the forecast period.
In 2019, household consumption will grow only moderately relative to the increase in purchasing power. There has been a considerable decline in consumer confidence. The slower growth in consumption is a consequence of an increased awareness of the prevailing risks coupled with precautionary savings. With the recovery in Finland’s external (operating) environment, households will once again have the confidence to consume more, and growth in private consumption will catch up with the pace of growth in purchasing power towards the end of the forecast period. The savings rate will remain higher than in recent years throughout the forecast period.
The labour market will cool as economic growth slows and growth in labour demand weakens. The downward trend in the unemployment rate will come to a halt temporarily, and employment will barely grow at all in 2020. Unemployment will, however, remain lower than in recent years. Labour market capacity restraints will ease somewhat as the market cycle abates. However, in many sectors and geographical areas there will still be problems of mismatch between vacant jobs and the available unemployed job-seekers.
Monetary policy has been moved in an increasingly accommodative direction, while fiscal policy will also be expansionary in the immediate years ahead. The low level of interest rates will bolster consumption and investment. Public finance indicators will weaken substantially, both on account of the weaker macroeconomic situation and due to the expansionary fiscal policy. The general government deficit relative to GDP will deepen to 1.5% in 2020 and thereafter remain at that level. Public debt relative to GDP will, for its part, begin to grow again in 2020 after contracting for the previous 4 years.
Wages are forecast to rise more-or-less in line with the aggregate of productivity growth and inflation. The forecast is based on the technical assumption that real wages follow developments in productivity. The annual increase in average earnings will average just under 2.5% in the forecast years. Earnings growth will also gradually push up services prices. Inflation will gather pace towards the end of the forecast period as the cyclical position improves, but will still be rather sluggish.
Table 1.
| Key forecast | ||||
|---|---|---|---|---|
| Percentage change on the previous year (june 2019 forecast) | ||||
| 2019f | 2020f | 2021f | 2022f | |
| GDP |
1.3 (1.6) |
0.9 (1.5) |
1.1 (1.3) |
1.3 |
| Private consumption | 0.7 | 1.3 | 1.2 | 1.2 |
| Public consumption | 1.6 | 1.3 | 0.5 | 0.8 |
| Fixed investment | 1.1 | 0.7 | 0.6 | 2.0 |
| Private fixed investment | 1.1 | –0.3 | 0.8 | 2.1 |
| Public fixed investment | 1.5 | 5.1 | –0.2 | 1.9 |
| Exports | 4.0 | 0.9 | 2.2 | 2.6 |
| Imports | 0.7 | 1.3 | 1.8 | 2.5 |
| Effect of demand components on growth | ||||
| Domestic demand | 1.0 | 1.1 | 0.9 | 1.3 |
| Net exports | 1.3 | –0.2 | 0.2 | 0.0 |
| Changes in inventories and statistical error | –1.0 | 0.0 | 0.0 | 0.0 |
| Savings rate, households, % | 0.3 | 0.9 | 0.7 | 0.6 |
| Current account, % in proportion to GDP | –1.3 | –1.3 | –1.1 | –0.9 |
| 2019f | 2020f | 2021f | 2022f | |
| Labour market | ||||
| Number of hours worked | 0.8 | –0.2 | 0.3 | 0.4 |
| Number of employed | 1.0 | 0.0 | 0.3 | 0.4 |
| Unemployment rate, % | 6.7 | 6.7 | 6.6 | 6.4 |
| Unit labour costs | 1.4 | 1.5 | 1.4 | 1.5 |
| Labour compensation per employee | 1.8 | 2.5 | 2.2 | 2.4 |
| Productivity | 0.3 | 1.0 | 0.8 | 0.9 |
| GDP, price index | 1.9 | 1.9 | 1.6 | 1.9 |
| Private consumption, price index | 1.2 | 1.2 | 1.3 | 1.6 |
| Harmonised index of consumer prices |
1.2 (1.3) |
1.2 (1.4) |
1.4 (1.6) |
1.6 |
| Excl. energy | 1.0 | 1.3 | 1.4 | 1.6 |
| Energy | 2.9 | 0.2 | 0.8 | 1.0 |
| f = forecast | ||||
| Source: Bank of Finland | ||||
Forecast assumptions regarding the external environment
Global and euro area growth will continue to be slow, but the pace will gradually start to pick up towards the end of the forecast period. 2019 and 2020 will prove to be the bottom of the global business cycle. Thus, global economic developments will start to help the Finnish economy to grow towards the end of the forecast period. On the other hand, there is still a great deal of uncertainty as regards the global economic outlook, and this overshadows the outlook for both exports and investment. The financial markets expect the very accommodative monetary policy in the euro area to continue throughout the forecast period. Favourable funding costs will support domestic investment and consumption. The forecast is based on the data available on 26 November 2019.
Global economic developments will remain subdued
Global economic growth began to slow in 2018, and the subdued developments continued through 2019. In particular, the global economy has borne the effects of the uncertainty surrounding the protracted trade disputes, and the volume of global trade has contracted in 2019 (Chart 1). Both the slower growth in China and other emerging economies and the uncertainties surrounding Brexit serve to weaken the outlook for Finnish exports.
chart 1.Average interest rates on new corporate loans in Finland slightly above rest of area
There are no signs of a rapid amelioration of the global uncertainty. However, the assumed gradual easing of the trade disputes and a moderate cyclical upturn will lead to a gradual recovery in global trade from the beginning of next year. This will support growth in Finland’s export markets, particularly towards the end of the forecast period (Chart 1). The rise in the export prices of Finland’s competitors has slowed significantly in 2019 as global demand has waned. This has weakened the price-competitiveness of Finnish exports. From 2020 onwards, however, Finland’s competitors’ export prices will grow at a steady rate of slightly above 2% (Table 2).
A marginal improvement in the global economy will also support euro area growth in the forecast period. Industry in the euro area, particularly in Germany, has suffered from the problems in global trade. By contrast, service sectors have still fared fairly well. Domestic demand has de facto maintained euro area growth in 2019. The moderate growth in private consumption and investment in the euro area will continue throughout the forecast period, due to the gradual recovery and continued accommodative monetary policy. This will support Finnish export demand, of which one third stems from the euro area.
Exchange rate developments will also contribute somewhat to growth in Finnish exports. In 2019, both the exchange rate for the euro against the dollar and the Finnish nominal effective exchange rate have weakened, which supports the price competitiveness of Finnish exports. The effective exchange rate is derived by summing developments in the exchange rates of Finland’s main trading partners relative to the euro weighted by bilateral trade weights. The effective exchange rate will remain stable throughout the forecast period (Table 2).
Euro area inflation has remained sluggish. In 2019, the subdued price developments were due particularly to a decrease in energy prices. A continued moderate fall in the oil price is expected in the forecast period, to a level of USD 60 a barrel at the end of the period (Table 2). By contrast, the prices of other industrial raw materials are expected to rise slightly in the forecast period.
The employment situation in the euro area is forecast to remain good during the forecast period. Rising labour costs and strengthening demand in line with the cyclical recovery will be reflected in prices and hence in a moderate acceleration of euro area inflation, particularly towards the end of the forecast period.
Monetary policy will remain accommodative
According to the forward guidance of the European Central Bank (ECB), interest rates will remain at their present or lower levels until the inflation outlook is robustly converging to a level sufficiently close to, but below, 2% and until this development is also consistently reflected in underlying inflation dynamics. The level of interest rates is still low. The interest rate on the main refinancing operations is 0.00%, on the marginal lending facility, 0.25%, and on the deposit facility, −0.50%. During autumn 2019, the accommodative nature of other aspects of monetary policy was also deepened further. At its September meeting, the Governing Council decided to restart net purchases of securities in the expanded asset purchase programme. In addition, the Governing Council also decided on other additional measures to support bank lending. Thus, overall, monetary policy will remain highly accommodative for longer than was expected in June.
Low funding costs will support growth
On the financial markets, a rise in interest rates is expected no earlier than 2022 (Table 2). Thus, funding costs for both private and public sectors are expected to remain low for the time being. This will support investments and consumption, strengthening the economic outlook.
On average, households’ interest rates on housing loans are lower in Finland than elsewhere in the euro area (Chart 2). The average interest rate on new housing loans has continued its slight downward trajectory, but at a much slower pace than the euro area average. Narrower interest rate margins have also reduced the overall costs of housing loans, although the decrease has halted in recent months. Annual percentage rates on new consumer credit have decreased slightly since the summer, but they are still higher than at the beginning of the year.
Corporate funding costs on new loans are, in turn, slightly higher than elsewhere in the euro area, albeit still moderate (Chart 3). According to the business outlook indicator calculated by the Confederation of Finnish Industries, the financial conditions of Finnish companies are still favourable in general terms and production is not restricted by access to funding.
chart 2.Households' savings rate remains positive
chart 3.Investment growth to slow during forecast period
Table 2.
| Key forecast assumptions | |||||
| 2018 | 2019f | 2020f | 2021f | 2022f | |
| Finland’s export markets1, annual growth (%) | 3.6 | 1.6 | 1.7 | 2.5 | 2.7 |
| Oil price, USD/barrel | 71.1 | 63.8 | 59.6 | 57.4 | 56.8 |
| Export prices of Finland’s competitors, in euro, annual growth (%) | 1.4 | 2.2 | 2.2 | 2.2 | 2.2 |
| 3-month Euribor, % | –0.3 | –0.4 | –0.4 | –0.4 | –0.3 |
| Finland’s 10-year government bond yield, % | 0.7 | 0.1 | 0.0 | 0.1 | 0.3 |
| Finland’s nominal competitiveness indicator2 | 106.8 | 106.3 | 105.9 | 105.9 | 105.9 |
| US dollar value of one euro | 1.18 | 1.12 | 1.10 | 1.10 | 1.10 |
| 1 The growth in Finland’s export markets is the import growth in the countries Finland exports to, weighted by their average share of Finland’s exports. | |||||
| 2 Broad nominal effective exchange rate. | |||||
| Sources: Eurosystem and Bank of Finland. | |||||
Demand
The global economy will continue to grow slowly in the forecast years, thus dampening Finland's outlook for exports and investment. Growth in private investment and exports will therefore slow significantly in the forecast period. Finland’s economic growth during this period will rest on private consumption and public demand (Chart 4). Household purchasing power will continue to grow, but the protracted weakening of household confidence will overshadow the outlook for growth in consumption. On the other hand, low financing costs and the moderate growth in purchasing power will continue to support household consumption. Government decisions will increase public demand, especially at the beginning of the forecast period.
chart 4.Strong growth in services exports
Private consumption to grow slowly
Household purchasing power will strengthen over the forecast period as the employment situation remains good and earnings rise. The moderate inflation will also bolster purchasing power. However, consumers’ confidence in Finland's and their own financial position has been weakening significantly for over a year now, overshadowed by the global economy, and consumers remain rather cautious. At the end of the forecast period, private consumption will grow, on average, in pace with purchasing power (Chart 5).
chart 5.Current account to remain in deficit
Employment has improved rapidly in recent years, strongly supporting the strengthening of purchasing power. However, the improvement in employment is clearly slowing down, and in the early part of the forecast period the growth in household purchasing power will depend solely on wage increases. Earnings will continue to grow steadily, at an annual rate of just below 2.5%, which will be sufficient to sustain growth in purchasing power. Taking into account the rise in consumer prices, households’ real earnings will grow in the forecast period at an average annual rate of around 1%. When also taking into account the improvement in employment at the end of the forecast period, households’ purchasing power, i.e. their real disposable income will grow at an average annual rate of 1.5% in the forecast years. However, from 2021 onwards, annual growth in purchasing power will slow to around 1%.
In addition to wage increases, household income will rise due to increasing current transfers and other income, such as capital income. At the same time, however, purchasing power will be dampened by a tightening in taxation and an increase in earnings-related pension contributions. Overall, the changes to taxation and current transfers will increase households’ disposable income.
Consumer confidence began to decline in 2018, but the situation stabilised during autumn 2019. However, consumer confidence remains low. Private consumption will grow more slowly in relation to purchasing power in 2020, but in 2020 and 2021 the growth rates will be roughly the same (Chart 5). Private consumption is set to increase by an average annual rate of slightly over 1% in the forecast years.
The slowing rate of consumption growth will also be reflected in the household savings rate, which will remain moderately positive throughout the forecast period. Despite this, household indebtedness will also continue to rise, partly due to the attractively low cost of finance.
Private investment set to decline in 2020
Growth in private investment will slow over the forecast horizon, especially due to the slowdown in housing construction. Growth in corporate fixed investment will also moderate early in the forecast period. Growth in private investment will slow to just above 1% in 2019, and in 2020 investment will contract slightly. Towards the end of the forecast period, growth in private investment will moderately accelerate to around 2% (Chart 6).
chart 6.Unemployment rate will fall below its structural level
Fixed investment growth in the corporate sector is expected to develop poorly early in the forecast period. Investment will be slowed by both the weaker cyclical conditions and economic uncertainty (Investment weakened by uncertainty and the structure of the Finnish economy). This is reflected in the broad decline in business confidence indicators during the past year, most radically in manufacturing. Growth in corporate fixed investment may exceed expectations, however, if current plans for large-scale investments are widely implemented.
Growth in construction has turned down. In the first half of 2019, construction continued at a brisk pace, but during the autumn it has clearly slowed. The number of new building permits began to fall sharply in mid-2018, and the decrease in the number of permits will be reflected in housing construction, especially in 2019 and 2020. Permit developments also suggest that commercial construction will slow in 2019. Growth in renovation work has also faded. Investment in public service construction and civil engineering works will continue to grow as a result of the Government's investment projects.
Non-financial corporations’ financing conditions will remain favourable. The interest rates on new corporate loans have remained low due to the accommodative monetary policy. Growth in domestic corporate loans has levelled off but is still brisker than in recent years. Access to finance is not a dominant bottleneck for companies. Instead, as the economic cycle cools, insufficient demand has become a dominant factor preventing growth for some companies in the manufacturing and services sectors.
Corporate sector profitability has improved uninterruptedly since 2013 and improved further in 2018. In the National Accounts, operating surplus is the counterpart of operating profits recorded in non-financial corporations’ financial statements. In 2018, the operating surplus from ordinary activities rose by just above 4%. Good corporate profitability creates the conditions for higher-than-anticipated investment growth.
General government deficit and debt rising
Weakening economic growth and rising age-related expenditure are causing pressures for growth in the general government deficit and debt (Assessment of public finances 2019). In addition, discretionary fiscal measures under the Government Programme will increase expenditure more than revenues. These factors will deepen the general government deficit, further increasing the debt-to-GDP ratio. At the same time, the structural deficit in general government finances and the sustainability gap will increase (Sustainability gap larger than previously projected).
Permanent expenditure increases under the Government Programme will increase total public expenditure by an average of just under 0.5% in proportion to GDP in 2020 and 2021 (compared to a situation where the fiscal stance had remained unchanged). In addition, the Government's one-off ‘future-oriented investments’ will increase spending in 2020–2022 by some 0.5% to GDP.
With the increase in intermediate consumption1 and employee compensation, the annual average growth in public consumption in 2019 and 2020 will be around 1.5% in real terms, after which growth will slow to less than 1%. The volume of public investment will grow rapidly, especially in 2020–2021. Declining debt-servicing costs will bring relief to the public finances. Also, unemployment expenditure will continue to contract significantly up to the end of 2019. Total expenditure will reach 52.9% in proportion to GDP in 2022.
Excise duties, such as taxes on tobacco and energy, will be raised in accordance with the Government Programme. On the other hand, the taxation of earned income for low-and middle-income households will be eased. Tax cuts and index adjustments in earned income taxation will reduce tax revenue in the general government finances. The total tax rate will be close to 42%, compared with just under 44% in 2016. The general government total revenue-to-GDP ratio will decrease in 2019, remain roughly unchanged in 2020–2021 and decrease by 0.2 of a percentage point, to 51.4% in 2022.
chart 7.Fixed investment remains negligible
The central government deficit will decline to 0.8% relative to GDP in 2019 but, due to the aforementioned discretionary fiscal measures, will increase to 1.3% in 2020. After 2020, the central government deficit will begin to decrease slightly (Chart 7). The local government deficit increased in 2018 and will continue to increase through 2019. The pressure of rising age-related spending will increase expenditure by the municipal authorities. The increase in central government transfers in 2020 will temporarily reverse the increase in the deficit. After this, however, the deficit will continue to grow. The surplus on the earnings-related pension funds will continue to decline due to rising earnings-related pension expenditure and modestly growing property income. Other social security funds will still post a slight surplus.
Overall, the general government nominal deficit will deepen to 1.5% in proportion to GDP in 2020 and thereafter remain unchanged until the end of the forecast period (Chart 7). The deficit will, therefore, remain below the reference value of the EU Treaty, at less than 3%. On the other hand, the structural deficit will deteriorate to the extent that it creates a risk of non-compliance with the preventive arm of the Stability and Growth Pact.
The growth in the debt ratio will be curbed by covering part of the one-off expenditures agreed upon in the Government Programme by selling central government financial assets. Nevertheless, the general government debt ratio will exceed the 60% reference value set in the EU Treaty as of 2021. In 2022, the debt ratio will be 60.8% (Chart 8).2
chart 8.Output gap closing
International uncertainty holds back exports
Finland has successfully strengthened exports and export market shares in recent years. Finnish export growth is overshadowed by the uncertainties created by protectionism and the weak outlook for world trade as well as slowing growth in the main export markets. The widespread weakening of confidence dampens global investment demand, which is important for Finnish exports. However, the general uncertainty and the slowdown in export market growth are expected to be temporary.
Finland's export structure is gradually shifting towards an increasing dominance of services, and export growth has been bolstered by strong growth in services exports since 2015. Meanwhile, the volume of goods exports has remained stagnant for several years (Chart 9). In mid-2019, the value of goods exports was almost the same as in 2017. Finnish services exports have grown especially due to growing export of business services, such as ICT services. However, there has also been a strong increase in the import of services, and Finland's foreign trade in services has been in deficit for many years. In recent years, however, the deficit has decreased. Overall, export growth slowed to 2.2% in 2018, which was slower than growth in the export markets. Net exports were particularly weak, as imports grew much faster than exports.
chart 9.Labour productivity growth subdued
The outlook for the global economy and the euro area has deteriorated markedly over the past year, and growth in the export markets has slowed significantly. Nevertheless, exports have grown quite strongly in 2019, partly due to temporary factors such as cruise ship deliveries. Net exports also improved clearly in 2019.
Export growth will slow to around 1% in 2020, as the pull from the export markets will remain almost as subdued as in 2019 and the impact of temporary factors on export growth will diminish. In addition, weak investment demand worldwide is hampering export growth in Finland, as Finnish exports are mostly focused on capital and intermediate goods. However, the dip in export growth will only be temporary, as the pick-up in the most important export markets in 2021 will start to accelerate export growth again towards the end of the forecast period. Demand for capital goods worldwide and in the euro area will gradually recover as uncertainty slowly begins to ease. As it stands, at the end of the forecast period and by 2022, export growth will accelerate to over 2.5% (Chart 10).
chart 10.Wages and labour costs will continue to rise
As export growth accelerates towards the end of the forecast period, so will import growth, as the export industry utilises a lot of imported inputs. The pick-up in domestic demand will also increase the need for imports towards the end of the forecast period. Consequently, net export growth will remain modest.
Despite the good export performance of recent years, the current account has been continuously in deficit since 2011 (Chart 11). In total, the current account deficit has deepened by nearly EUR 25 billion over 8 years, which means that Finland has accumulated a corresponding amount of foreign debt. The main causes for the growing current account deficit include the service account deficit and current transfers. Not even the rapid growth in exports of recent years has been enough to erode the current account deficit. The negative balance of goods and services combined with current transfers paid will also keep the current account in deficit in the immediate years ahead.
chart 11.Realisation of global risks would slow export growth
Supply and cyclical conditions
Over the past few years, GDP has grown faster than its estimated potential, but now growth is slowing cyclically. As the economic cycle cools, capacity constraints will ease slightly. Due to the slowing economic growth, demand for labour will also decline. Towards the end of the forecast horizon, economic growth will broadly mirror the pace of potential output growth. Productivity growth will remain subdued and the ageing of the population will constrain labour supply.
Employment growth will come to a temporary halt
Employment growth in 2019 has been slower than in the previous year and will continue to fade over the forecast period. Growth in the number of employed will come to an almost complete standstill in 2020 and will grow only slowly at the end of the forecast period. The employment rate will rise to just above 73% in 2022. The unemployment rate will remain at its current level of just above 6.5% over the next few years and decrease only slightly at the end of the forecast period. Labour force participation will increase slightly (Chart 12).
chart 12.Average interest rates on new housing loans still low
Indicators for employment growth point to a broadly based weakening of employment developments. Companies' employment expectations have weakened, especially in industry and construction. The service sector is the only one in which employment expectations have not yet shown signs of deterioration. The number of job vacancies in relation to unemployed jobseekers, an indicator for the tightness of the labour market, has continued to increase despite the subdued labour market situation. However, the increased number of vacancies has not led to a reduction in unemployment. On the other hand, the rise in indicators of a shortage of skilled labour has come to a halt or indicators have begun to decline, suggesting a slight easing of labour market tightness and problems relating to labour market mismatches.
The exceptionally strong development of employment in recent years might, on one hand, be partly explained by the good cyclical conditions and, on the other hand, by structural labour market reforms carried out in recent years, which may have expanded the scope for employment growth. However, the employment effects of the structural measures may have already been largely achieved, and, in addition, some new measures, such as benefit increases and dismantling of the activation model, will further weaken the attractiveness of employment compared with unemployment.
The slower rise of labour costs relative to productivity growth may also have created conditions conducive to employment growth. The Competitiveness Pact lowered labour costs and, in real terms, they continued to grow more slowly relative to productivity in the subsequent wage negotiation round as well. Due to the weakened cyclical conditions, wage developments over the next few years will have a major impact on labour demand (Alternative scenario: Recovery in global economy delayed).
The decline in the working-age population (aged 15–64) will contribute to limiting the increase in the number of employed persons in the forecast years. The number of 15–74 year-olds will also begin to decline during the forecast period, which will further weaken the supply of labour. Labour force growth will be muted early in the forecast period, but increase at the end, so that the participation rate will rise from around 66.5% in 2019 to just under 67.5% by the end of the period.
When employment growth peaked in 2018, the rapid growth was partly explained by the fact that economic growth was reflected on the labour market above all as an improvement in employment. At the same time, labour productivity actually slowed. Over the forecast period, economic growth is expected to be based on a slight growth in productivity, thus having only a limited impact on employment growth.
The unemployment rate has dropped by almost one percentage point from the previous year, but the decline is expected to come to a temporary halt at the beginning of the forecast period as the effects of the slowdown in the international economy reach Finland. The unemployment rate has remained below the estimated level of structural unemployment for a protracted period, which indicates that the declining unemployment is at least partly cyclical. The decreasing probability of finding work and the increasing number of laid-off workers and workers facing possible lay-off points towards a weakening unemployment trend. The estimate of the level of structural unemployment in the medium term has increased slightly, partly reflecting the weakening incentives for labour supply.
chart 13.Economic growth rests primarily on domestic demand
Companies’ capacity constraints easing slightly
Since the cooling of the economic cycle, the constraints on growth have also stopped increasing. The capacity utilisation rate has decreased from its cyclical peak, and labour shortage problems as reported by employers have eased somewhat. Due to the weakening of the international economy, utilisation rates have fallen to their average level (Chart 14).
chart 14.Investment growth to slow during forecast period
Due to the slowdown in economic growth, capacity constraints will slightly ease over the next few years. Corporate fixed investment will continue to increase, partly limiting the tightening of capacity constraints. Despite the increase in corporate fixed investment over the past few years and improved corporate operating surpluses, both investment and operating surplus in relation to GDP remain much lower than before the financial crisis (Chart 15). Production capacity increases have been hampered by international uncertainty and structural factors in the Finnish economy, such as weak productivity development, population ageing and the structural transition to a service economy. (Investment weakened by uncertainty and the structure of the Finnish economy).
chart 15.General government debt will exceed 60% in proportion to of GDP
Due to the weakened cyclical conditions and shrunken order books, insufficient demand has become a major factor preventing growth, especially in the manufacturing sector, but also in construction and services (Chart 16). On the other hand, the shortage of skilled labour that manufacturing and construction have long suffered from has eased. Recruitment problems remain the most significant constraint on growth in the service sectors. In the construction sector, recruitment problems will continue to ease as growth in the sector slows, but labour shortages may be structural in many service sectors, as labour supply is restricted by the decline in the working-age population.
chart 16.Export growth set to dip briefly
Soft landing — and return towards long-term potential growth rate
The peak of the economic cycle has passed. Over the past few years, GDP has grown faster than its estimated potential,3 but now growth is slowing cyclically. At the end of the forecast period, GDP will grow more or less at the potential rate of output.
The output gap remained negative both in Finland and in the euro area for an exceptionally long period during the double-dip recession that followed the financial crisis, meaning that economic resources were being underutilised. As economic conditions lifted, the capacity utilisation rate also grew, unemployment decreased and the output gap turned positive. In the forecast years, the positive output gap will close, as economic growth will slow. The positive output gap in the euro area economy, which is important for Finland, is also melting (Chart 17).4As it stands, slightly more economic slack is available for raising production than before.
chart 17.Employment growth slowing
The growth in potential output is much slower than before the financial crisis (Chart 18). Total factor productivity has strengthened since the protracted downturn, but it is nevertheless far below the record years. In 2019–2022, an increase in investment will boost the capital stock and strengthen potential output. Towards the end of the forecast period, the importance of labour as a source of potential output will fade. The supply of labour will wither despite the projected improvement in the employment rate. Labour supply will be limited as the 15–74-year-old population begins to decrease and structural unemployment remains high.
chart 18.Constraints on growth no longer increasing
During the cyclical upswing, labour productivity growth accelerated temporarily. When the peak of the cycle has passed, labour productivity growth will also slow. In 2019–2022, labour productivity will grow by less than 1%. The higher capital intensity of the economy will, however, improve labour productivity slightly, reflecting the larger amount of capital available per hours worked (Chart 19).
Labour productivity growth is set to remain considerably slower than in the first post-millennium years, when the annual growth rate averaged 2.5%.5 Slower productivity growth has also been witnessed in many other advanced economies (see e.g. OECD Economic outlook, May 2019, chapter 2).
chart 19.Business surveys show that insufficient demand has become a major constraint on output growth
Wages, prices and costs
Inflation will remain moderate, but will accelerate somewhat during the forecast period, as cyclical conditions improve slightly and nominal earnings pick up. Nominal wage growth will contribute especially to growth in services prices. Goods prices, however, are expected to continue to decline in the early part of the forecast period, so core inflation will remain moderate. The outcomes of the collective agreements due for renegotiation in 2019 and 2020 will play a role in laying the path for Finnish cost-competitiveness.
Consumer price inflation will remain moderate
In 2019, inflation as measured by the Harmonised Index of Consumer Prices (HICP) will remain at 1.2%, as in 2018. Price pressures will remain slight on account of the subdued phase of the economic cycle, which will continue to be reflected in prices in 2020, when consumer price growth will persist at 1.2%. Inflation will accelerate to 1.4% and 1.6% towards the end of the forecast period, in 2021 and 2022, respectively, as cyclical conditions gradually pick up (Chart 20).
chart 20.Potential output growth subdued
Nominal earnings growth during the forecast period will contribute especially to services price inflation, which is projected to accelerate to over 2% in 2020. Goods prices, however, are expected to continue to decline domestically early on in the forecast period, while corresponding prices are on a slight rise in the euro area, on average.
Increased product taxes, which the consumer pays as higher prices on goods or services, will spur inflation during the forecast period. Excise duties on tobacco products will be increased stepwise over 2020–2023, as per the Government Programme. In addition, the taxation of soft drinks and transport fuels will be tightened in 2020. The tax increase on transport fuels will take effect in August 2020, and its impact will still be reflected in prices in 2021.
Import prices have, taken as a whole, remained at a similar level in 2019 as in 2018. One exception is energy imports, whose prices entered a decline in 2019 after strong growth in preceding years. Import prices will continue to grow at a moderate pace in the subsequent years of the forecast period.
Wages and labour costs will continue to rise
Growth in nominal earnings will continue to accelerate in 2019 (Chart 21). Average labour costs, which in addition to earnings also include employers’ social security contributions, will increase by 1.8% in 2019. Average labour productivity will resume growth following a slump in 2018 and will grow at around 1% per annum during the forecast horizon. Unit labour costs will increase at an annual average of 1.3% during the forecast period.
chart 21.Consumer price inflation will remain moderate
Finnish collective labour agreements will be renegotiated extensively in 2019 and 2020. Because many of the negotiated outcomes are as yet unknown at the time of the forecast, the forecast's wage projections are based on the technical assumption that real wage growth will approximately reflect productivity growth in 2020–2022. This assumption is based on the relationship between real wages and productivity established in economic theory as well as their historical co-movement. If developments in the euro area are as forecast, Finland will retain the progress it has achieved in recent years in improving its cost-competitiveness relative to the euro area (Chart 22). Conversely, if wages increase faster than productivity, Finnish cost-competiveness will suffer.
In the economy as a whole, nominal earnings will increase by an average 2.4% per annum during 2020–2022, as measured by the index of wage and salary earnings, i.e. at a similar pace as in 2019. Equivalently, nominal earnings will rise at an average pace of 2.4% per annum during the forecast years, when measured as growth of average hourly earnings based on the wage bill. In 2019, average labour cost growth will be much more moderate than growth in average earnings, on account of the reductions in employers’ social security contributions, but in the latter years of the forecast labour costs are projected to grow at a similar pace as average earnings. The Competitiveness Pact's temporary cuts to public sector holiday bonuses will expire in 2020, resulting in a temporary rise in wage growth.
chart 22.Finland will retain its cost-competitiveness relative to the euro area
Risk assessment
The risks in the forecast are tilted on the downside. Developments in the global operating environment are surrounded by many uncertainties, the realisation of which would dampen economic growth. The outlook for Finnish exports is shrouded by the growing protectionism, possible further escalation of trade disputes, Brexit uncertainties, worsening internal problems in the Chinese economy and, in particular, the downside risks to euro area growth. By contrast, domestic risks are not as clearly on the downside, but could also, if materialised, lead to better-than-forecast developments.
Global risks suggest weaker-than-expected growth
Developments in global demand and hence in Finland’s export markets will in 2019 remain much slower than expected in the June forecast. The largest downside risks stem from the global economy and the euro area (Table 3).
The trade war between the United States and China re-escalated in the summer. The effects of the trade war have shown as a slowdown in the global economy and trade. The Chinese economy has also been clouded by internal problems. Chinese growth is being held back by, for example, increased corporate funding problems, private and public sector debt accumulation and delayed structural reforms to the economy. A slump in Chinese growth easily aggravates problems in other emerging economies, too. In addition to fading trade flows, global growth has been overshadowed by the general uncertainty surrounding future economic developments. As regards Finnish exports, a drop in investment demand due to increased uncertainty has been particularly devastating.
The euro area is of key importance to Finnish exports. Continued economic growth in the euro area is surrounded by many uncertainties, which, if they materialise, may lead to weaker-than-expected developments. As regards the individual euro area countries, the biggest question mark is over the direction of the German economy. German export industry has suffered severely from the trade disputes. Euro area growth is expected to start recovering in 2020, but investments, in particular, will take time to recover. A slower-than-expected recovery in the economy of the euro area and Germany would considerably hamper the outlook for Finnish exports and growth.
In the euro area, the confusion surrounding Britain’s exit from the EU has also increased uncertainty. In the past few months it has looked increasingly unlikely that the UK will end up with a no-deal Brexit. However, new turns in the exit process may still occur.
Although the risks to the international economy seem to be predominantly on the downside, the possibility of stronger-than-expected developments cannot be entirely ruled out. In particular, a clearer-than-expected dissipation of uncertainties relating to the trade disputes and Brexit would support a faster-than-forecast recovery of the global economy and the euro area.
Table 3.
Weaker-than-expected developments in the euro area and Germany would hamper Finnish growth
|
External risks |
|
(–) A steeper-than-expected slowdown of euro area growth, and the condition of the German economy |
|
(–) Protectionism and a spreading trade war, and the impact on Finland’s export markets |
|
(–) A no-deal Brexit |
|
(–) Escalation of the problems in the Chinese economy |
|
(+) Faster-than-forecast dissipation of uncertainties relating to global economic developments |
Realisation of global risks would hit exports
The risks to global economic developments particularly dampen the outlook for Finnish foreign trade. According to the forecast assumptions, global trade and Finnish export demand will gradually start to recover from 2021. However, a realisation of downward risks to the global economy could lead to weakened growth in global import demand, i.e. in Finland’s export markets, which again could substantially dampen the growth of Finnish exports compared with the baseline forecast.
Risks to export market developments and the related forecast uncertainty may be illustrated by fan charts (Chart 23). The forecast uncertainty includes both export market growth uncertainty and an assessment of predominantly downside risks. The fluctuation range of export market growth has been estimated based on the historical evolution of variables illustrating developments in export demand. In the scenario of Chart 23 it is assumed that growth in Finland’s export markets will take a downward turn starting in 2020. Thus the uncertainty around the forecast baseline is asymmetric.
When this uncertainty is taken into account, growth in Finnish exports varies from –4 to 4% in 2020, whereas its baseline growth is estimated to be just below 1% (Chart 23). Thus a realisation of the risks to global trade could clearly dampen Finnish export demand and in a worst-case scenario lead to a contraction of exports already in 2020. Weakened export demand would also negatively affect the economy as a whole (Alternative scenario: Recovery in global economy delayed).
Domestic factors could also favour faster-than-expected growth
Economic developments are also attended by risks stemming from domestic factors (Table 4). Both private consumption and corporate fixed investment may grow faster than estimated. Corporate profitability is good, and funding costs low. Recently firms have been investing in production capacity, which could also lead to more-favourable-than-expected export developments, particularly as export markets recover towards the end of the forecast period.
Finnish labour costs have been rising moderately for several years, thereby strengthening the competitiveness of Finnish exporters. On the other hand, if pay rises in the ongoing wage negotiations grow beyond those in competing countries, the competitiveness of the export sector would weaken and exports could develop less favourably than forecast.
However, domestic investments have recently been concentrated on construction, and particularly housing construction. The housing construction cycle has already turned down and may deteriorate more than forecast if the economic recovery is delayed. This would weaken the development of total investments compared with the forecast baseline.
Although household purchasing power is still growing, a decline in consumer confidence is restraining consumption growth. If the uncertainty over the direction of the economy dissipates as the economy recovers, private consumption may gain momentum more swiftly than forecast.
On the other hand, household indebtedness has increased in recent years. Households’ debt burden could be a risk in the event of a deteriorating economy and unemployment increasing significantly more than forecast. Indebted households would then have to cut their consumption to meet their debt-servicing costs, which would slow economic growth even further.
chart 23.Economic growth rests primarily on domestic demand
Table 4.
Good financial situation of domestic companies and households may lead to faster-than-expected growth
|
Domestic risks |
|
(+) Faster-than-expected growth in corporate fixed investment due to good profitability |
|
(+) Faster-than-expected growth in private consumption, reflecting economic growth |
|
(–) Faster-than-expected contraction in housing construction |
|
(–) Deteriorating export competitiveness, if pay rises considerably outgrow productivity performance |
|
(–) Household indebtedness in a situation of a significantly weakening economy |
Notes
-
Intermediate consumption refers to the procurement of goods and services for the purpose of producing other goods and/or services. ↑
-
The debt figures include the debt increases caused by the fighter aircraft procurement programme from 2021 onwards. ↑
-
Potential output is the level of real GDP when all the economy’s factors of production are fully utilised. ↑
-
The output gap assessment is based on e.g. the unobserved components model (An unobserved components model for Finland: Estimates of potential output and NAWRU). ↑
-
The slowdown in productivity growth reflects e.g. the smaller weight and lower productivity of high-productivity industries, the increased importance of services in the economy, a shift in investment from fixed capital investment to housing as well as a contraction in the share of R&D investment. ↑