Analysis
Finland's cyclical expansion bolstered by investment and export growth
The Finnish economy entered a phase of cyclical recovery in mid-2015. After several years of contraction and zero growth, Finnish GDP grew by 1.9% in 2016. Growth has continued to accelerate during the course of 2017. The current cyclical upturn has been supported by growth in exports and investment. Finland’s economy has also benefited from the broader recoveries seen in both the euro area and the global economy.
Finnish GDP growth was largely dependent upon private consumption during the period of low growth in 2012–2015 (Chart 1). In 2016, investment increased sharply by 7.2% (Table 1), while export growth also gathered pace over the same period. This trend has continued into the current year, and both investment and exports have seen robust growth.
While investment growth is commonly associated with quickening domestic demand and construction, corporate fixed investment is also sensitive to the fluctuations of the global economy and export markets. Monetary policy and availability of funding have also played a large role in shaping investment growth. The prolonged contraction in investment and resulting degradation of fixed assets (e.g. obsolescence and wear and tear) could also help explain the surge in investment activity. Most importantly, however, confidence in the economy has strengthened, while at the same time profit development has outpaced costs, resulting in ideal conditions for investment.
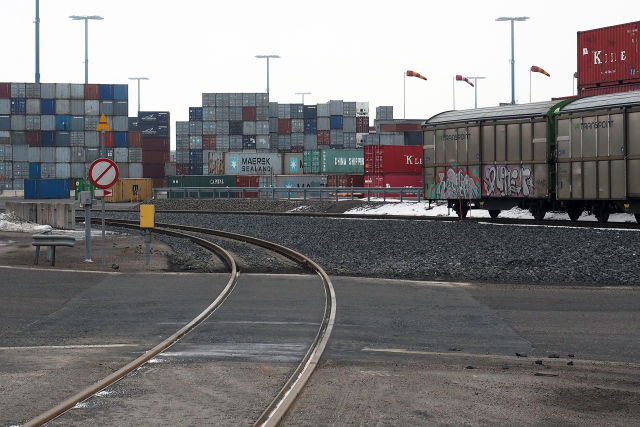
chart 1.Export growth broadly based
According to Statistics Finland's annual national accounts, the majority of investment flowed to the service sector. Firms within the service industry accounted for 5.8 percentage points of the total increase in investment. The contribution of secondary production was much smaller, at 1.3 percentage points.
The service sector's prominence was largely driven by new-build construction, which accounted for 3.3 percentage points of investment growth in 2016. In addition, the domestic trade sector has seen substantial investment, particularly in wholesaling. Investment in transportation and storage has also been strong. Public sector investment also increased in 2016, where it had trended poorly in earlier years.
Table 1.
| Investment by sector | |||||
| Gross fixed capital formation | 2014 | 2015 | 2016 | ||
| Secondary production | 0.1 | 0.8 | 1.3 | ||
| B_E Industry. total | 0.1 | 0.8 | 1.1 | ||
| B Mining and quarrying | –0.1 | 0.2 | 0.0 | ||
| C Manufacturing | –0.2 | 0.5 | 0.0 | ||
| 16_17 Forest industries | –0.4 | 0.3 | 0.6 | ||
| 19_22 Chemical industry | –0.4 | 0.8 | –0.4 | ||
| 24_25+28_30+33 Metal industry excl. manufacture of electrical and electronic products | 0.3 | 0.2 | 0.0 | ||
| 26_27 Manufacture of electrical and electronic products | 0.1 | –0.7 | –0.5 | ||
| D_E Electricity and water supply and waste management | 0.3 | 0.1 | 1.0 | ||
| F Construction | 0.0 | 0.0 | 0.3 | ||
| Services | –0.3 | 0.5 | 5.8 | ||
| G Trade | 0.1 | –0.8 | 0.9 | ||
| H Transportation and storage | –0.5 | 0.2 | 1.0 | ||
| J Information and communication | 0.7 | 0.1 | –0.5 | ||
| L Real estate activities | –3.6 | 2.2 | 3.3 | ||
| Public administration: education. healthcare and social services | 0.2 | –1.6 | 0.7 | ||
| Source: Statistics Finland. | |||||
The secondary sector saw much slower investment growth than services. Industrial investment accounted for 1.1 percentage points of total investment growth in 2016, of which the majority went to the energy supply and forest industries. Investment in electrical engineering and electronics and other metals-related industries contracted in 2016. The secondary sector’s seemingly modest investment growth belies the fact that secondary production extensively uses the service industry's intermediate goods as inputs (see Pekkarinen, 2017). As such, some service sector investments do actually flow into the secondary sector.
Finnish exports surged in early 2017 and enjoyed an improved market share, both geographically and across commodity categories. Goods exports have had a major impact on GDP growth (Chart 2). Services exports have also increased, but at a slower pace. While services account for a much smaller share of total exports, their domestic value added is larger than that of goods. As such, services exports actually have a larger impact on GDP than if it were explained only by its share of total exports.
Data collected by the Finnish Customs provide a breakdown of export growth by country of import and commodity category. Export growth has been geographically broad and particularly rapid during the past year. Germany in particular has increased its intake of Finnish exports. This has had a considerable effect on the composition of export growth, as Germany has now become Finland's most important export destination. Exports to China, Sweden and Russia have also increased notably during the past year. Overall, exports have increased with almost all of Finland’s major trading partners.
chart 2.Export growth broadly based
Export volumes increased across the board for practically all major goods. Looking at individual commodities, basic metals saw the greatest improvement in early 2017. In addition, machinery and equipment exports turned to growth, ending a prolonged period of decline, and the export value of motor vehicles also exhibited a surge.
Exports have been supported by international as well as domestic factors, with a particular emphasis on the former. External demand and price factors account for approximately two-thirds of the growth in exports, according to the Bank of Finland’s dynamic general equilibrium model, Aino. Monetary policy and exchange rates, in turn, account for approximately one fifth of export growth. Finland’s export markets have been developing favourably since late 2016, and world trade has recently experienced a surge in growth. Wage development has remained modest. This, coupled with overall subdued cost developments, has improved Finland’s cost-competitiveness. Corporate taxation has also been eased, improving the profitability of firms.