Analysis
One country, many housing markets

Hanna Putkuri
AdviserRegional divergence is a strong feature of the Finnish housing market and household debt. House prices are higher in growth centres than in the rest of the country, and households in growth centres also have more housing debt both in absolute terms and relative to their income. In the long term, the mutually reinforcing cycles and vulnerabilities in housing and credit markets could turn out to be detrimental to financial stability and the macroeconomy.
Half of housing debt borne by few households
Around every second household in Finland has debt – and every third household has housing debt. The need for and availability of credit depends on e.g. the form of housing, the phase of life and the financial situation of the household. About half of owner-occupiers and those aged 25–54 have housing debt.1
A typical household with housing debt has about EUR 74,000 of housing loan (median). However, the differences between households are considerable. In the quartile of households with the largest housing debts, the size of a housing loan is over EUR 134,000 (upper quartile), as opposed to below EUR 31,000 (lower quartile) in the quartile of households with the smallest housing debts. The average size of a housing loan per household with housing debt is about EUR 94,000.
Information on the distribution of housing debt indicates that debt is concentrated on a relatively restricted group of the most indebted households. Hence, a large amount of housing debt in absolute terms is borne by a small proportion of households. Households with large housing loans usually also have a large debt burden in relation to their annual income.
About half of the total amount of housing debt is with the most indebted tenth of all households (Chart 1). These households’ aggregate debts taken out for different purposes are over three times their annual disposable monetary income.2 Less than a third of all households with housing debt belong to this group of households that are strongly indebted in relation to their income. In this category, the average size of a housing loan is EUR 163,000 per household.
The remaining half of housing debt is with households whose debts are at most three times their disposable monetary income. These households account for about a fourth of all households (over two-thirds of all households with housing debt), and the average housing loan size in this category is EUR 66,000 per household.
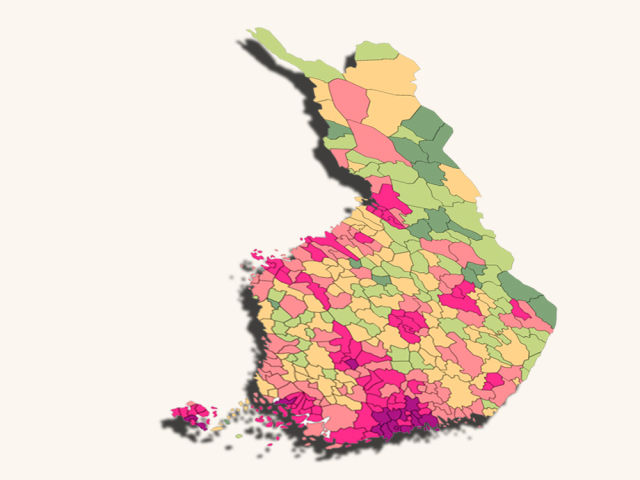
chart 1.Average amount of housing loan per household with housing debt, by municipality in Finland
Housing debt concentrated in growth centres
Migration and accumulation of housing debt are stronger in the Helsinki metropolitan area and regional growth centres than elsewhere in Finland. Population growth centres include the areas in and around Helsinki, Jyväskylä, Kuopio, Oulu, Seinäjoki, Tampere, Turku and Vaasa.
Finnish municipalities can be divided into different categories according to the housing loan-related indebtedness of their residents. In a typical municipality, the average amount of housing loan per household with housing debt is over EUR 71,000. Housing loans that are larger than this are most frequent in the Helsinki metropolitan area and its surrounding municipalities, and in regional centres and their environs (Chart 2). The largest housing loans are found in the Helsinki sub-region.
In growth centres, households also have more debt in relation to their income. For example, in the Helsinki metropolitan area, elsewhere in the Uusimaa region and in Åland, housing loans of households with housing debt are almost twice the amount of their disposable monetary income. In the rest of the country, the ratio of housing debt to annual income of a household with housing debt is about 170%. For the country as a whole, the ratio is about 180%.
chart 2.Finnish households and housing debt by debt ratio
Debt and prices go hand in hand
Growth areas are characterised not only by increasing population numbers but also by younger residents than in the whole country on average, a better employment situation, lower unemployment and higher average income per household. This is also reflected in brisker housing markets and higher house prices per square metre in these areas.
There is naturally a strong link between housing prices and housing loan-related indebtedness. This is also evident at the municipal level in that households with housing debt have on average larger housing loans in municipalities where house prices per square metre are higher (Chart 3).
The relation between housing loan-related indebtedness and house price developments is important from the perspective of financial stability. The mutually reinforcing cycles in housing and credit markets may in the long term turn out to be detrimental to financial and macroeconomic stability.
History has shown in several countries – including Finland – that credit and housing markets tend to overheat and create debt-driven asset price bubbles during economic upswings. When the bubble bursts, housing prices can drop abruptly, whereas excessive indebtedness can only be reduced slowly in crisis situations.
To dampen household indebtedness and the mutually reinforcing relationship between growth in indebtedness and house prices, Finland is introducing a binding maximum cap on housing loans (loan-to-value ratio) in July 2016. The loan cap will restrict the maximum size of a new housing loan relative to the aggregate value of the related housing and other guarantees. Some countries have also mitigated the risks and vulnerabilities associated with lending for house purchase by restricting the maximum loan size in relation to the borrower’s income or by requiring more capital from the credit institutions to cover for unexpected losses. For more details, see the article ‘A broader set of tools needed to prevent financial crises’.
chart 3.Housing debt and house prices by municipality in Finland
Notes
-
The calculations are based on Statistics Finland’s Household Wealth Survey and statistics on indebtedness. The most recent figures for these have been published in 2015 and pertain to the situation in 2013. ↑
-
Disposable monetary income includes a household’s monetary income and benefits in kind related to employment relationships minus direct taxes, social security contributions and other income transfers paid by the household. Monetary income excludes imputed income items, such as imputed housing income. ↑