Forecast
Forecast tables for 2017–2019
See forecast tables for the Finnish economy in 2017–2019.
December 2016
| Source: Bank of Finland forecast December 2016. | |||||
| 1. BALANCE OF SUPPLY AND DEMAND, AT REFERENCE YEAR 2010 PRICES | |||||
| % change on previous year | |||||
| 2015 | 2016 | 2017f | 2018f | 2019f | |
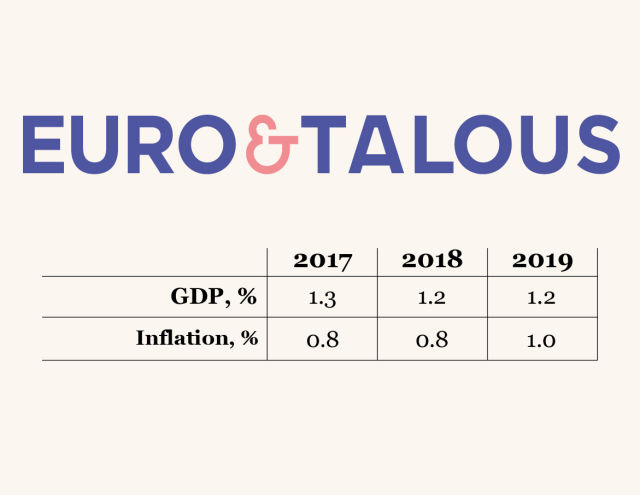
| GDP at market prices | 0.2 | 1.0 | 1.3 | 1.2 | 1.2 |
| Imports of goods and services | 1.9 | 1.2 | 2.0 | 2.1 | 1.9 |
| Exports of goods and services | -0.2 | 0.7 | 2.1 | 2.5 | 2.6 |
| Private consumption | 1.5 | 1.9 | 1.4 | 1.0 | 0.9 |
| Public consumption | 0.4 | 0.3 | 0.3 | 0.3 | -0.3 |
| Private fixed investment | 2.2 | 5.8 | 3.4 | 2.5 | 2.7 |
| Public fixed investment | -5.1 | 3.1 | 0.6 | -0.2 | -0.1 |
| Source: Bank of Finland forecast December 2016. | |||||
| 2. CONTRIBUTIONS TO GROWTH1 | |||||
| 2015 | 2016 | 2017f | 2018f | 2019f | |
| GDP, % change | 0.2 | 1.0 | 1.3 | 1.2 | 1.2 |
| Net exports | -0.8 | -0.2 | 0.0 | 0.1 | 0.3 |
| Domestic demand excl. inventory change | 1.0 | 2.2 | 1.5 | 1.1 | 0.9 |
| of which Consumption | 0.9 | 1.2 | 0.8 | 0.6 | 0.4 |
| Investment | 0.1 | 1.1 | 0.6 | 0.4 | 0.5 |
| Inventory change + statistical discrepancy | 0.0 | -1.1 | -0.2 | 0.0 | 0.0 |
| 1 Bank of Finland calculations. Annual growth rates using the previous year's GDP shares at current prices as weights. | |||||
| Source: Bank of Finland forecast December 2016. | |||||
| 3. BALANCE OF SUPPLY AND DEMAND, PRICE DEFLATORS | |||||
| Index 2010 = 100, and % change on previous year | |||||
| 2015 | 2016 | 2017f | 2018f | 2019f | |
| GDP at market prices | 112.0 | 113.3 | 113.2 | 113.6 | 114.4 |
| 1.6 | 1.2 | -0.1 | 0.3 | 0.7 | |
| Imports of goods and services | 100.6 | 98.5 | 101.6 | 104.3 | 106.5 |
| -4.0 | -2.0 | 3.1 | 2.7 | 2.1 | |
| Exports of goods and services | 103.3 | 100.7 | 103.2 | 105.2 | 107.1 |
| -0.9 | -2.5 | 2.5 | 2.0 | 1.8 | |
| Private consumption | 110.8 | 111.4 | 112.0 | 112.7 | 113.6 |
| 0.4 | 0.5 | 0.6 | 0.7 | 0.8 | |
| Public consumption | 112.6 | 114.3 | 113.7 | 114.1 | 114.8 |
| 0.2 | 1.5 | -0.5 | 0.4 | 0.6 | |
| Private fixed investment | 109.4 | 111.2 | 112.4 | 113.4 | 114.9 |
| 0.5 | 1.6 | 1.0 | 0.9 | 1.3 | |
| Public fixed investment | 110.3 | 112.2 | 114.3 | 114.8 | 115.6 |
| 0.1 | 1.7 | 1.9 | 0.4 | 0.8 | |
| Terms of trade (goods and services) | 102.7 | 102.2 | 101.6 | 100.9 | 100.6 |
| 3.3 | -0.5 | -0.6 | -0.7 | -0.3 | |
| Source: Bank of Finland forecast December 2016. | |||||
| 4. BALANCE OF SUPPLY AND DEMAND, AT CURRENT PRICES | |||||
| EUR million and % change on previous year | |||||
| 2015 | 2016 | 2017f | 2018f | 2019f | |
| GDP at market prices | 209,149 | 213,663 | 216,225 | 219,620 | 223,805 |
| 1.8 | 2.2 | 1.2 | 1.6 | 1.9 | |
| Imports of goods and services | 77,548 | 76,869 | 80,780 | 84,665 | 88,096 |
| -2.2 | -0.9 | 5.1 | 4.8 | 4.1 | |
| Total supply | 286,697 | 290,532 | 297,005 | 304,286 | 311,901 |
| 0.7 | 1.3 | 2.2 | 2.5 | 2.5 | |
| Exports of goods and services | 76,579 | 75,193 | 78,715 | 82,286 | 85,969 |
| -1.0 | -1.8 | 4.7 | 4.5 | 4.5 | |
| Consumption | 166,733 | 170,560 | 172,795 | 175,163 | 177,429 |
| 1.5 | 2.3 | 1.3 | 1.4 | 1.3 | |
| Private | 115,711 | 118,595 | 120,929 | 122,941 | 125,049 |
| 1.8 | 2.5 | 2.0 | 1.7 | 1.7 | |
| Public | 51,022 | 51,965 | 51,865 | 52,221 | 52,380 |
| 0.6 | 1.8 | -0.2 | 0.7 | 0.3 | |
| Fixed investment | 42,718 | 45,695 | 47,582 | 48,931 | 50,603 |
| 1.1 | 7.0 | 4.1 | 2.8 | 3.4 | |
| Private | 34,562 | 37,146 | 38,821 | 40,154 | 41,771 |
| 2.7 | 7.5 | 4.5 | 3.4 | 4.0 | |
| Public | 8,156 | 8,549 | 8,761 | 8,777 | 8,832 |
| -5.1 | 4.8 | 2.5 | 0.2 | 0.6 | |
| Inventory change + statistical discrepancy | 667 | -916 | -2,086 | -2,094 | -2,101 |
| % of previous year's total demand | 0.0 | -0.6 | -0.4 | 0.0 | 0.0 |
| Total demand | 286,697 | 290,532 | 297,005 | 304,286 | 311,901 |
| 0.7 | 1.3 | 2.2 | 2.5 | 2.5 | |
| Total domestic demand | 210,118 | 215,339 | 218,291 | 221,999 | 225,931 |
| 1.4 | 2.5 | 1.4 | 1.7 | 1.8 | |
| Source: Bank of Finland forecast December 2016. | |||||
| 5. BALANCE OF SUPPLY AND DEMAND | |||||
| % of GDP at current prices | |||||
| 2015 | 2016 | 2017f | 2018f | 2019f | |
| GDP at market prices | 100.0 | 100.0 | 100.0 | 100.0 | 100.0 |
| Imports of goods and services | 37.1 | 36.0 | 37.4 | 38.6 | 39.4 |
| Exports of goods and services | 36.6 | 35.2 | 36.4 | 37.5 | 38.4 |
| Consumption | 79.7 | 79.8 | 79.9 | 79.8 | 79.3 |
| Private | 55.3 | 55.5 | 55.9 | 56.0 | 55.9 |
| Public | 24.4 | 24.3 | 24.0 | 23.8 | 23.4 |
| Fixed investment | 20.4 | 21.4 | 22.0 | 22.3 | 22.6 |
| Private | 16.5 | 17.4 | 18.0 | 18.3 | 18.7 |
| Public | 3.9 | 4.0 | 4.1 | 4.0 | 3.9 |
| Inventory change + statistical discrepancy, | 0.3 | -0.4 | -1.0 | -1.0 | -0.9 |
| Total demand | 137.1 | 136.0 | 137.4 | 138.6 | 139.4 |
| Total domestic demand | 100.5 | 100.8 | 101.0 | 101.1 | 101.0 |
| Source: Bank of Finland forecast December 2016. | |||||
| 6. PRICES | |||||
| Index 2010 = 100, and % change on previous year | |||||
| 2015 | 2016 | 2017f | 2018f | 2019f | |
| Harmonised index of consumer prices, 2005=100 | 100.0 | 100.4 | 101.1 | 102.0 | 103.0 |
| -0.2 | 0.4 | 0.8 | 0.8 | 1.0 | |
| Consumer price index, 2005=100 | 100.0 | 100.4 | 101.1 | 101.9 | 102.9 |
| -0.2 | 0.4 | 0.7 | 0.8 | 1.0 | |
| Private consumption deflator | 110.8 | 111.4 | 112.0 | 112.7 | 113.6 |
| 0.4 | 0.5 | 0.6 | 0.7 | 0.8 | |
| Private investment deflator | 109.4 | 111.2 | 112.4 | 113.4 | 114.9 |
| 0.5 | 1.6 | 1.0 | 0.9 | 1.3 | |
| Exports of goods and services deflator | 103.3 | 100.7 | 103.2 | 105.2 | 107.1 |
| -0.9 | -2.5 | 2.5 | 2.0 | 1.8 | |
| Imports of goods and services deflator | 100.6 | 98.5 | 101.6 | 104.3 | 106.5 |
| -4.0 | -2.0 | 3.1 | 2.7 | 2.1 | |
| Value-added deflators | |||||
| Value-added, gross at basic prices | 111.9 | 113.8 | 113.9 | 114.4 | 115.2 |
| 1.8 | 1.6 | 0.2 | 0.4 | 0.7 | |
| Private sector | 111.2 | 113.3 | 113.8 | 114.2 | 115.0 |
| 2.1 | 1.9 | 0.4 | 0.4 | 0.7 | |
| Public sector | 115.1 | 115.5 | 114.7 | 115.0 | 115.9 |
| 0.7 | 0.4 | -0.8 | 0.3 | 0.8 | |
| Source: Bank of Finland forecast December 2016. | |||||
| 7. WAGES AND PRODUCTIVITY | |||||
| % change on previous year | |||||
| 2015 | 2016 | 2017f | 2018f | 2019f | |
| Whole economy | |||||
| Index of wage and salary earnings | 1.4 | 1.3 | 0.3 | 0.8 | 1.3 |
| Compensation per employee | 1.6 | 1.1 | -0.5 | 0.6 | 1.0 |
| Unit labour costs | 1.0 | 0.5 | -1.2 | 0.0 | 0.4 |
| Labour productivity per employed person | 0.6 | 0.6 | 0.7 | 0.7 | 0.5 |
| Source: Bank of Finland forecast December 2016. | |||||
| 8. LABOUR MARKET | |||||
| 1,000 persons and % change on previous year | |||||
| 2015 | 2016 | 2017f | 2018f | 2019f | |
| Labour force survey (15–74-year-olds) | |||||
| Employed persons | 2,437 | 2,446 | 2,460 | 2,474 | 2,491 |
| -0.4 | 0.4 | 0.6 | 0.6 | 0.7 | |
| Unemployed persons | 252 | 237 | 228 | 224 | 223 |
| 8.7 | -6.2 | -3.7 | -1.7 | -0.5 | |
| Labour force | 2,689 | 2,683 | 2,688 | 2,698 | 2,714 |
| 0.4 | -0.3 | 0.2 | 0.4 | 0.6 | |
| Working-age population (15–64-year-olds) | 3,474 | 3,463 | 3,452 | 3,444 | 3,437 |
| -0.4 | -0.3 | -0.3 | -0.2 | -0.2 | |
| Labour force participation rate, % | 65.6 | 65.3 | 65.2 | 65.3 | 65.6 |
| Unemployment rate, % | 9.4 | 8.8 | 8.5 | 8.3 | 8.2 |
| Employment rate (15–64-year-olds), % | 68.1 | 68.6 | 69.1 | 69.7 | 70.2 |
| Source: Bank of Finland forecast December 2016. | |||||
| 9. GENERAL GOVERNMENT REVENUE, EXPENDITURE, BALANCE AND DEBT | |||||
| % OF GDP | |||||
| 2015 | 2016 | 2017f | 2018f | 2019f | |
| General government revenue | 54.9 | 54.9 | 54.3 | 54.2 | 54.0 |
| General government expenditure | 57.7 | 57.4 | 56.9 | 56.6 | 56.2 |
| General government primary expenditure | 56.5 | 56.4 | 55.9 | 55.7 | 55.3 |
| General government interest expenditure | 1.2 | 1.0 | 1.0 | 0.9 | 0.9 |
| General government net lending | -2.8 | -2.5 | -2.6 | -2.4 | -2.2 |
| Central government | -3.0 | -2.9 | -2.8 | -2.5 | -2.0 |
| Local government | -0.6 | -0.7 | -0.6 | -0.6 | -0.6 |
| Social security funds | 0.9 | 1.1 | 0.8 | 0.6 | 0.4 |
| General government primary balance | -1.6 | -1.4 | -1.7 | -1.5 | -1.3 |
| General government debt (EDP) | 63.6 | 65.6 | 68.2 | 70.1 | 71.3 |
| Central government debt | 47.7 | 49.4 | 51.6 | 53.3 | 54.3 |
| Tax ratio | 44.1 | 44.2 | 43.7 | 43.7 | 43.6 |
| Source: Bank of Finland forecast December 2016. | |||||
| 10. BALANCE OF PAYMENTS | |||||
| EUR million | |||||
| 2015 | 2016 | 2017f | 2018f | 2019f | |
| Exports of goods and services (SNA) | 76,579 | 75,193 | 78,715 | 82,286 | 85,969 |
| Imports of goods and services (SNA) | 77,548 | 76,869 | 80,780 | 84,665 | 88,096 |
| Goods and services account (SNA) | -969 | -1,676 | -2,065 | -2,379 | -2,126 |
| % of GDP | -0.5 | -0.8 | -1.0 | -1.1 | -1.0 |
| Investment income and other items, net (+ statistical discrepancy) | 2,420 | 2,109 | 2,222 | 2,212 | 2,202 |
| Current transfers, net | -2321 | -2068 | -2096 | -2132 | -2176 |
| Current account, net | -870 | -1,636 | -1,939 | -2,299 | -2,100 |
| Net lending, % of GDP | |||||
| Private sector | 2.3 | 1.7 | 1.7 | 1.4 | 1.3 |
| Public sector | -2.8 | -2.5 | -2.6 | -2.4 | -2.2 |
| Current account, % of GDP | -0.4 | -0.8 | -0.9 | -1.0 | -0.9 |
| Source: Bank of Finland forecast December 2016. | |||||
| 11. INTEREST RATES | |||||
| % | |||||
| 2015 | 2016 | 2017f | 2018f | 2019f | |
| 3-month Euribor1 | 0.0 | -0.3 | -0.3 | -0.2 | 0.0 |
| Average interest rate on new loan drawdowns2 | 2.1 | 1.8 | 1.8 | 1.9 | 2.1 |
| Average interest rate on the stock of loans2 | 1.6 | 1.5 | 1.4 | 1.5 | 1.6 |
| Average interest rate on the stock of deposits3 | 0.3 | 0.2 | 0.1 | 0.1 | 0.2 |
| Yield on Finnish 10-year government bonds1 | 0.7 | 0.4 | 0.7 | 0.9 | 1.1 |
| 1 Technical assumption derived from market expectations. | |||||
| 2 Finnish credit institutions’ loans to households and non-financial corporations (excl. overdrafts, credit card credits and repurchase agreements). | |||||
| 3 Finnish credit institutions’ deposits from households and non-financial corporations. | |||||
| Source: Bank of Finland forecast December 2016. | |||||
| 12. INTERNATIONAL ENVIRONMENT | |||||
| The Eurosystem staff projections | |||||
| 2015 | 2016 | 2017f | 2018f | 2019f | |
| GDP, % change on previous year | |||||
| World | 3.1 | 2.9 | 3.3 | 3.4 | 3.5 |
| USA | 2.6 | 1.5 | 2.0 | 2.0 | 2.0 |
| Euro area | 1.9 | 1.7 | 1.7 | 1.6 | 1.6 |
| Japan | 0.6 | 0.7 | 0.9 | 0.8 | 0.7 |
| Imports, % change on previous year | |||||
| World | 1.9 | 1.5 | 3.2 | 3.9 | 4.0 |
| USA | 4.6 | 0.7 | 3.0 | 4.5 | 4.4 |
| Euro area | 6.2 | 3.3 | 4.1 | 4.3 | 4.1 |
| Japan | 0.4 | -1.7 | 1.5 | 2.7 | 3.0 |
| Index, 2010 = 100, and % change on previous year | |||||
| Import volume in Finnish export markets | 113.1 | 115.2 | 118.4 | 122.7 | 127.2 |
| 0.1 | 1.8 | 2.8 | 3.6 | 3.7 | |
| Export prices (excl. oil) of Finland's trading partners, national currencies | 102.7 | 101.0 | 103.8 | 106.3 | 108.6 |
| -0.5 | -1.7 | 2.7 | 2.4 | 2.2 | |
| Export prices (excl. oil) of Finland's trading partners, in euro | 109.1 | 105.8 | 107.2 | 109.8 | 112.2 |
| 3.9 | -3.0 | 1.3 | 2.4 | 2.2 | |
| Industrial raw materials (excl. energy), HWWA index, in US dollars | 98.0 | 95.9 | 104.1 | 107.8 | 112.8 |
| -25.0 | -2.1 | 8.6 | 3.6 | 4.6 | |
| Oil price, USD per barrel1 | 52.4 | 43.1 | 49.3 | 52.6 | 54.6 |
| -47.1 | -17.6 | 14.3 | 6.7 | 3.7 | |
| Finland's nominal competitiveness indicator1, 2 | 97.8 | 99.1 | 100.5 | 100.5 | 100.5 |
| -4.3 | 1.4 | 1.4 | 0.0 | 0.0 | |
| US dollar value of one euro1 | 1.11 | 1.11 | 1.09 | 1.09 | 1.09 |
| -16.5 | 0.2 | -1.9 | 0.0 | 0.0 | |
| 1 Technical assumption derived from market expectations. | |||||
| 2 Narrow plus euro area, 1999Q1 = 100 | |||||
| Source: Bank of Finland forecast December 2016. | ||||
| 13. Current and June 2016 forecast | ||||
| 2016 | 2017f | 2018f | 2019f | |
| GDP, % change | 1.0 | 1.3 | 1.2 | 1.2 |
| June 2016 | 1.1 | 1.1 | 1.0 | |
| Inflation (HICP), % | 0.4 | 0.8 | 0.8 | 1.0 |
| June 2016 | 0.2 | 0.8 | 1.0 | |
| Current account, % of GDP | -0.8 | -0.9 | -1.0 | -0.9 |
| June 2016 | -0.6 | -0.8 | -0.7 | |
| General government net lending, % of GDP | -2.5 | -2.6 | -2.4 | -2.2 |
| June 2016 | -2.6 | -2.4 | -2.3 | |
| General government debt (EDP), % of GDP | 65.6 | 68.2 | 70.1 | 71.3 |
| June 2016 | 66.0 | 68.4 | 70.2 | |
| Unemployment rate, % | 8.8 | 8.5 | 8.3 | 8.2 |
| June 2016 | 9.2 | 9.0 | 8.9 | |