Forecast
Forecast tables 2025–2028 (December 2025)
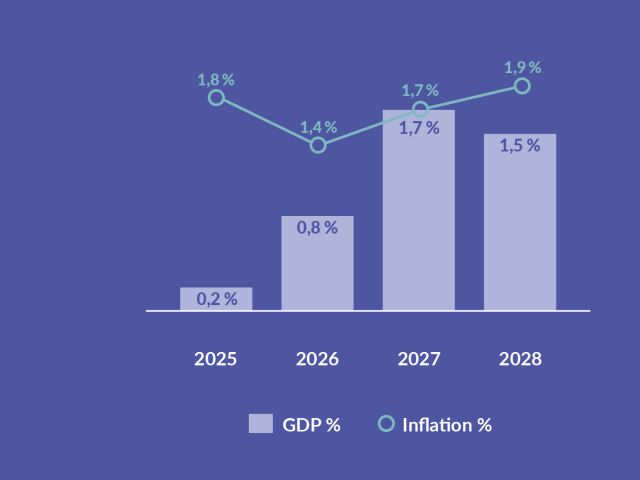
Growth in the economy for the full year 2025 will be 0.2%. Growth will rise to 0.8% in 2026 and to 1.7% in 2027. In 2028, the final year of the forecast period, growth will level out at 1.5%.
| % change on previous year | 2024 | 2025ᶠ | 2026ᶠ | 2027ᶠ | 2028ᶠ |
|---|---|---|---|---|---|
| GDP at market prices | 0.4 | 0.2 | 0.8 | 1.7 | 1.5 |
| Imports of goods and services | -0.8 | 1.9 | 5.2 | 2.6 | 2.9 |
| Exports of goods and services | 1.8 | 4.1 | 2.4 | 2.7 | 2.7 |
| Private consumption | -0.4 | -0.1 | 1.1 | 1.9 | 1.9 |
| Public consumption | 1.7 | -2.0 | -0.4 | 0.2 | 0.7 |
| Private fixed investment | -7.7 | -0.3 | 3.9 | 3.8 | 3.3 |
| Public fixed investment | 7.7 | 2.3 | 18.3 | -0.4 | -2.6 |
| f=forecast. | |||||
| Sources: Bank of Finland and Statistics Finland. | |||||
| 2024 | 2025ᶠ | 2026ᶠ | 2027ᶠ | 2028ᶠ | |
|---|---|---|---|---|---|
| GDP, % change | 0.4 | 0.2 | 0.8 | 1.7 | 1.5 |
| Net exports | 1.1 | 0.9 | -1.1 | 0.1 | -0.0 |
| Domestic demand excl. inventory change | -0.9 | -0.5 | 1.9 | 1.6 | 1.6 |
| of which Consumption | 0.3 | -0.6 | 0.4 | 1.0 | 1.1 |
| Investment | -1.2 | 0.0 | 1.5 | 0.6 | 0.5 |
| Inventory change + statistical discrepancy | 0.2 | -0.2 | 0.0 | 0.0 | 0.0 |
| 1 Bank of Finland calculations. Annual growth rates using the previous year's GDP shares at current prices as weights. | |||||
| f=forecast. | |||||
| Sources: Bank of Finland and Statistics Finland. | |||||
| Index 2015=100, and % change on previous year | 2024 | 2025ᶠ | 2026ᶠ | 2027ᶠ | 2028ᶠ |
|---|---|---|---|---|---|
| GDP at market prices | 120.4 | 122.5 | 125.4 | 128.2 | 131.0 |
| 0.7 | 1.7 | 2.3 | 2.2 | 2.2 | |
| Imports of goods and services | 124.2 | 122.3 | 123.2 | 125.2 | 127.1 |
| -1.0 | -1.5 | 0.7 | 1.6 | 1.6 | |
| Exports of goods and services | 121.4 | 120.1 | 121.7 | 124.0 | 126.5 |
| -2.6 | -1.1 | 1.4 | 1.9 | 2.0 | |
| Private consumption | 119.2 | 120.7 | 122.4 | 124.5 | 126.9 |
| 1.0 | 1.2 | 1.4 | 1.7 | 1.9 | |
| Public consumption | 121.4 | 123.9 | 127.9 | 131.9 | 135.1 |
| 0.8 | 2.1 | 3.2 | 3.2 | 2.4 | |
| Private fixed investment | 127.3 | 127.4 | 128.5 | 130.9 | 133.1 |
| 0.2 | 0.1 | 0.9 | 1.9 | 1.7 | |
| Public fixed investment | 123.5 | 124.0 | 125.5 | 128.2 | 131.1 |
| 0.6 | 0.4 | 1.3 | 2.1 | 2.3 | |
| Terms of trade (goods and services) | 97.7 | 98.2 | 98.8 | 99.1 | 99.5 |
| -1.7 | 0.5 | 0.6 | 0.3 | 0.4 | |
| f=forecast. | |||||
| Sources: Bank of Finland and Statistics Finland. | |||||
| EUR million and % change on previous year | 2024 | 2025ᶠ | 2026ᶠ | 2027ᶠ | 2028ᶠ |
|---|---|---|---|---|---|
| GDP at market prices | 276,006 | 281,256 | 290,287 | 301,901 | 313,323 |
| 1.2 | 1.9 | 3.2 | 4.0 | 3.8 | |
| Imports of goods and services | 114,669 | 115,019 | 121,914 | 127,092 | 132,750 |
| -1.7 | 0.3 | 6.0 | 4.2 | 4.5 | |
| Total supply | 390,675 | 396,275 | 412,200 | 428,993 | 446,073 |
| 0.3 | 1.4 | 4.0 | 4.1 | 4.0 | |
| Exports of goods and services | 115,650 | 119,062 | 123,587 | 129,353 | 135,540 |
| -1.0 | 3.0 | 3.8 | 4.7 | 4.8 | |
| Consumption | 213,091 | 214,772 | 220,303 | 228,180 | 236,434 |
| 1.3 | 0.8 | 2.6 | 3.6 | 3.6 | |
| Private | 141,164 | 142,795 | 146,334 | 151,696 | 157,569 |
| 0.7 | 1.2 | 2.5 | 3.7 | 3.9 | |
| Public | 71,927 | 71,977 | 73,969 | 76,483 | 78,866 |
| 2.6 | 0.1 | 2.8 | 3.4 | 3.1 | |
| Fixed investment | 60,698 | 60,899 | 65,720 | 68,861 | 71,499 |
| -4.7 | 0.3 | 7.9 | 4.8 | 3.8 | |
| Private | 48,619 | 48,495 | 50,860 | 53,761 | 56,447 |
| -7.5 | -0.3 | 4.9 | 5.7 | 5.0 | |
| Public | 12,079 | 12,405 | 14,860 | 15,100 | 15,051 |
| 8.3 | 2.7 | 19.8 | 1.6 | -0.3 | |
| Inventory change + statistical discrepancy | 1,236 | 1,541 | 2,590 | 2,600 | 2,600 |
| % of previous year's total demand | 0.6 | 0.1 | 0.3 | 0.0 | 0.0 |
| Total demand | 390,675 | 396,275 | 412,200 | 428,993 | 446,073 |
| 0.3 | 1.4 | 4.0 | 4.1 | 4.0 | |
| Total domestic demand | 275,025 | 277,212 | 288,613 | 299,640 | 310,533 |
| 0.8 | 0.8 | 4.1 | 3.8 | 3.6 | |
| f=forecast. | |||||
| Sources: Bank of Finland and Statistics Finland. | |||||
| % in proportion to GDP at current prices | 2024 | 2025ᶠ | 2026ᶠ | 2027ᶠ | 2028ᶠ |
|---|---|---|---|---|---|
| GDP at market prices | 100.0 | 100.0 | 100.0 | 100.0 | 100.0 |
| Imports of goods and services | 41.5 | 40.9 | 42.0 | 42.1 | 42.4 |
| Exports of goods and services | 41.9 | 42.3 | 42.6 | 42.8 | 43.3 |
| Consumption | 77.2 | 76.4 | 75.9 | 75.6 | 75.5 |
| Private | 51.1 | 50.8 | 50.4 | 50.2 | 50.3 |
| Public | 26.1 | 25.6 | 25.5 | 25.3 | 25.2 |
| Fixed investment | 22.0 | 21.7 | 22.6 | 22.8 | 22.8 |
| Private | 17.6 | 17.2 | 17.5 | 17.8 | 18.0 |
| Public | 4.4 | 4.4 | 5.1 | 5.0 | 4.8 |
| Inventory change + statistical discrepancy | 0.4 | 0.5 | 0.9 | 0.9 | 0.8 |
| Total demand | 141.5 | 140.9 | 142.0 | 142.1 | 142.4 |
| Total domestic demand | 99.6 | 98.6 | 99.4 | 99.3 | 99.1 |
| f=forecast. | |||||
| Sources: Bank of Finland and Statistics Finland. | |||||
| Index 2015=100, and % change on previous year | 2024 | 2025ᶠ | 2026ᶠ | 2027ᶠ | 2028ᶠ |
|---|---|---|---|---|---|
| Harmonised index of consumer prices, 2015=100 | 119.8 | 122.0 | 123.7 | 125.8 | 128.2 |
| 1.0 | 1.8 | 1.4 | 1.7 | 1.9 | |
| Harmonised index of consumer prices excl. energy and food, 2015=100 | 115.0 | 117.7 | 119.5 | 121.6 | 123.6 |
| 2.2 | 2.4 | 1.6 | 1.7 | 1.6 | |
| Consumer price index, 2015=100 | 122.3 | 122.8 | 123.9 | 126.0 | 128.4 |
| 1.6 | 0.3 | 1.0 | 1.7 | 1.9 | |
| Private consumption deflator | 119.2 | 120.7 | 122.4 | 124.5 | 126.9 |
| 1.0 | 1.2 | 1.4 | 1.7 | 1.9 | |
| Private investment deflator | 127.3 | 127.4 | 128.5 | 130.9 | 133.1 |
| 0.2 | 0.1 | 0.9 | 1.9 | 1.7 | |
| Exports of goods and services deflator | 121.4 | 120.1 | 121.7 | 124.0 | 126.5 |
| -2.6 | -1.1 | 1.4 | 1.9 | 2.0 | |
| Imports of goods and services deflator | 124.2 | 122.3 | 123.2 | 125.2 | 127.1 |
| -1.0 | -1.5 | 0.7 | 1.6 | 1.6 | |
| Value-added deflators | |||||
| Value added, gross at basic prices | 120.5 | 122.1 | 124.7 | 127.5 | 130.3 |
| 0.7 | 1.3 | 2.2 | 2.2 | 2.2 | |
| f=forecast. | |||||
| Sources: Bank of Finland and Statistics Finland. | |||||
| % change on previous year | 2024 | 2025ᶠ | 2026ᶠ | 2027ᶠ | 2028ᶠ |
|---|---|---|---|---|---|
| Whole economy | |||||
| Index of wage and salary earnings | 3.1 | 3.0 | 3.4 | 3.3 | 2.6 |
| Compensation per employee | 1.7 | 3.1 | 3.1 | 3.2 | 2.5 |
| Unit labour costs | 0.2 | 2.5 | 3.1 | 2.4 | 1.7 |
| Productivity per employed person | 1.5 | 0.6 | 0.1 | 0.8 | 0.8 |
| f=forecast. | |||||
| Sources: Bank of Finland and Statistics Finland. | |||||
| 1,000 persons and % change on previous year | 2024 | 2025ᶠ | 2026ᶠ | 2027ᶠ | 2028ᶠ |
|---|---|---|---|---|---|
| Labour force survey (15–74-year-olds) | |||||
| Employed persons | 2,603.1 | 2,591.9 | 2,612.3 | 2,635.5 | 2,654.6 |
| -1.1 | -0.4 | 0.8 | 0.9 | 0.7 | |
| Unemployed persons | 239.3 | 277.9 | 288.6 | 269.9 | 259.3 |
| 16.5 | 16.1 | 3.9 | -6.5 | -3.9 | |
| Labour force | 2,842.4 | 2,869.8 | 2,900.9 | 2,905.4 | 2,913.9 |
| 0.2 | 1.0 | 1.1 | 0.2 | 0.3 | |
| Working-age population (15–64-year-olds) | 3,473.6 | 3,492.7 | 3,510.4 | 3,529.1 | 3,546.0 |
| 0.9 | 0.5 | 0.5 | 0.5 | 0.5 | |
| Labour force participation rate, % | 68.4 | 68.9 | 69.4 | 69.2 | 69.1 |
| Unemployment rate, % | 8.4 | 9.7 | 9.9 | 9.3 | 8.9 |
| Employment rate (20–64-year-olds), % | 76.7 | 76.1 | 76.2 | 76.5 | 76.6 |
| f=forecast. | |||||
| Sources: Bank of Finland and Statistics Finland. | |||||
| 2024 | 2025ᶠ | 2026ᶠ | 2027ᶠ | 2028ᶠ | |
|---|---|---|---|---|---|
| % relative to GDP | |||||
| General government revenue | 53.3 | 53.3 | 53.1 | 52.5 | 52.3 |
| General government expenditure | 57.7 | 57.0 | 57.4 | 56.6 | 56.2 |
| General government primary expenditure | 56.1 | 55.5 | 55.7 | 54.8 | 54.2 |
| General government interest expenditure | 1.6 | 1.5 | 1.6 | 1.8 | 1.9 |
| General government net lending | -4.4 | -3.7 | -4.3 | -4.1 | -3.9 |
| Central government | -3.7 | -3.3 | -4.2 | -4.1 | -4.0 |
| Local government | -0.9 | -0.8 | -0.7 | -0.8 | -0.9 |
| Social security funds | 0.2 | 0.4 | 0.7 | 0.7 | 1.0 |
| General government primary balance | -2.8 | -2.2 | -2.6 | -2.3 | -1.9 |
| General government structural balance¹ | -3.0 | -2.2 | -2.9 | -3.2 | -3.4 |
| General government debt (EDP) | 82.4 | 88.2 | 90.6 | 91.4 | 93.0 |
| Central government debt | 61.4 | 66.4 | 68.9 | 70.0 | 71.7 |
| Tax ratio | 42.2 | 42.1 | 42.1 | 41.8 | 41.6 |
| Current prices, EUR billion | |||||
| General government net lending | -12.2 | -10.4 | -12.4 | -12.4 | -12.1 |
| Central government | -10.2 | -9.4 | -12.3 | -12.2 | -12.6 |
| Local government | -2.6 | -2.2 | -2.2 | -2.3 | -2.8 |
| Social security funds | 0.6 | 1.2 | 2.1 | 2.2 | 3.2 |
| General government debt (EDP) | 227.5 | 247.9 | 262.9 | 276.1 | 291.5 |
| 1Based on the cyclical adjustment method used by the European System of Central Banks. | |||||
| f=forecast. | |||||
| Sources: Bank of Finland and Statistics Finland. | |||||
| EUR billion | 2024 | 2025ᶠ | 2026ᶠ | 2027ᶠ | 2028ᶠ |
|---|---|---|---|---|---|
| Exports of goods and services (SNA)1 | 115.7 | 119.1 | 123.6 | 129.4 | 135.5 |
| Imports of goods and services (SNA)1 | 114.7 | 115.0 | 121.9 | 127.1 | 132.8 |
| Goods and services account (SNA)1 | 1.0 | 4.0 | 1.7 | 2.3 | 2.8 |
| % of GDP | 0.4 | 1.4 | 0.6 | 0.7 | 0.9 |
| Investment income and other items, net (+ statistical discrepancy) | -0.8 | 0.9 | 0.9 | 0.9 | 0.9 |
| Current transfers, net | -1.4 | -1.7 | -2.0 | -2.2 | -2.4 |
| Current account, net | -1.9 | 3.0 | 0.6 | 1.0 | 1.3 |
| Net lending, % of GDP | |||||
| Private sector | 3.7 | 4.8 | 4.5 | 4.4 | 4.3 |
| Public sector | -4.4 | -3.7 | -4.3 | -4.1 | -3.9 |
| Current account, % of GDP | -0.7 | 1.1 | 0.2 | 0.3 | 0.4 |
| f=forecast. | |||||
| 1SNA = System of National Accounts | |||||
| Sources: Bank of Finland and Statistics Finland. | |||||
| % | 2024 | 2025ᶠ | 2026ᶠ | 2027ᶠ | 2028ᶠ |
|---|---|---|---|---|---|
| 3-month Euribor1 | 3.6 | 2.2 | 2.0 | 2.1 | 2.3 |
| Yield on Finnish 10-year government bonds1 | 2.8 | 3.0 | 3.1 | 3.3 | 3.5 |
| 1Technical assumption derived from market expectations. | |||||
| f=forecast. | |||||
| Sources: European Central Bank and Bank of Finland. | |||||
| Eurosystem staff projections | 2024 | 2025ᶠ | 2026ᶠ | 2027ᶠ | 2028ᶠ | |
|---|---|---|---|---|---|---|
| GDP, % change on previous year | ||||||
| World (excl. euro area) | 3.6 | 3.5 | 3.3 | 3.3 | 3.3 | |
| USA | 2.8 | 1.9 | 2.0 | 2.0 | 1.9 | |
| Euro area | 0.9 | 1.4 | 1.2 | 1.4 | 1.4 | |
| Japan | -0.2 | 1.3 | 0.5 | 0.8 | 0.8 | |
| Imports, % change on previous year | ||||||
| World (excl. euro area) | 4.3 | 4.4 | 2.0 | 3.1 | 3.1 | |
| USA | 5.8 | 2.5 | -2.9 | 2.7 | 3.0 | |
| Euro area | -0.1 | 3.2 | 2.3 | 2.7 | 2.8 | |
| Japan | 1.0 | 4.2 | 2.1 | 2.4 | 2.4 | |
| Index, 2015=100, and % change on previous year | ||||||
| Import volume in Finnish export markets | 121.5 | 125.8 | 128.4 | 132.2 | 136.0 | |
| 2.4 | 3.5 | 2.1 | 2.9 | 2.9 | ||
| Export prices of Finland's trading partners, national currencies | 128.9 | 129.7 | 131.4 | 133.9 | 136.5 | |
| 1.5 | 0.6 | 1.3 | 1.9 | 1.9 | ||
| Export prices of Finland's trading partners, in EUR | 125.1 | 123.9 | 124.2 | 126.6 | 129.0 | |
| 0.2 | -0.9 | 0.2 | 1.9 | 1.9 | ||
| Industrial raw materials (excl. energy), HWWA index, in USD | 152.1 | 160.9 | 161.0 | 161.8 | 161.4 | |
| 9.2 | 5.7 | 0.1 | 0.5 | -0.3 | ||
| Oil price, USD/barrel1 | 81.2 | 69.2 | 62.5 | 62.6 | 64.0 | |
| -2.9 | -14.8 | -9.7 | 0.2 | 2.2 | ||
| Finland's nominal effective exchange rate2 | 103.0 | 104.7 | 105.8 | 105.8 | 105.8 | |
| -1.3 | -1.5 | -1.1 | 0.0 | 0.0 | ||
| US dollar value of one euro3 | 1.1 | 1.1 | 1.2 | 1.2 | 1.2 | |
| 0.1 | 4.3 | 2.6 | 0.0 | 0.0 | ||
| 1Technical assumption derived from market expectations. | ||||||
| 2 Broad nominal effective exchange rate, January – March 2015 = 100. The index rises as the currency depreciates. Assuming no changes in the exchange rate. | ||||||
| 3 Assuming no changes in the exchange rate. | ||||||
| f=forecast. | ||||||
| Sources: European Central Bank and Bank of Finland. | ||||||
| 2024 | 2025ᶠ | 2026ᶠ | 2027ᶠ | 2028ᶠ | |
|---|---|---|---|---|---|
| GDP, % change | 0.4 | 0.2 | 0.8 | 1.7 | 1.5 |
| December 2024 | -0.1 | 0.5 | 1.5 | 1.6 | #N/A |
| Inflation (HICP), % | 1.0 | 1.8 | 1.4 | 1.7 | 1.9 |
| December 2024 | 1.0 | 1.7 | 1.4 | 1.8 | #N/A |
| Employment rate (20–64-year-olds), % | 76.7 | 76.1 | 76.2 | 76.5 | 76.6 |
| December 2024 | 76.7 | 76.1 | 76.2 | 76.4 | #N/A |
| Unemployment rate, % | 8.4 | 9.7 | 9.9 | 9.3 | 8.9 |
| December 2024 | 8.4 | 9.2 | 9.0 | 8.5 | #N/A |
| Current account, % of GDP | -0.7 | 1.1 | 0.2 | 0.3 | 0.4 |
| December 2024 | 0.3 | -0.4 | -0.1 | -0.1 | #N/A |
| General government net lending, % of GDP | -4.4 | -3.7 | -4.3 | -4.1 | -3.9 |
| December 2024 | -4.4 | -3.9 | -3.8 | -3.6 | #N/A |
| General government debt (EDP), % of GDP | 82.4 | 88.2 | 90.6 | 91.4 | 93.0 |
| December 2024 | 82.1 | 84.9 | 86.7 | 87.9 | #N/A |
| f=forecast. | |||||
| Sources: Bank of Finland and Statistics Finland. | |||||