Forecast
Economic growth has passed its cyclical peak
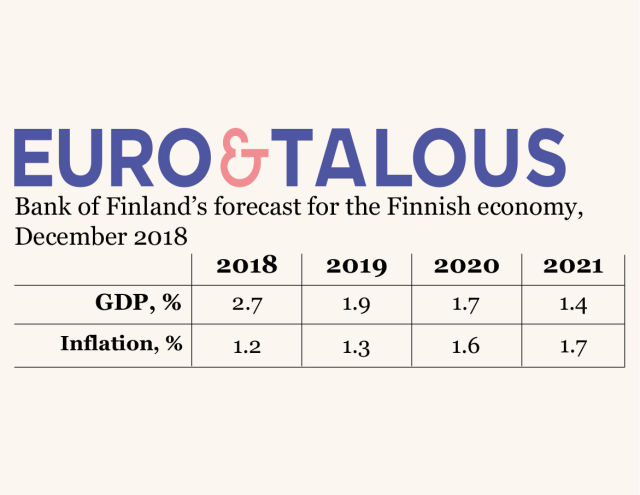
The Finnish economy will continue to grow, but more moderately than in the past two years and at a considerably slower pace than prior to the onset of the financial crisis in 2008. In 2018, GDP will grow by 2.7%. In 2019, economic growth will first moderate to 1.9%, before abating further and converging towards its long-term potential rate, at just under 1.5%.

External forecast assumptions
The performance of the world economy continues to support growth in Finland, even amid a slightly weakened global economic outlook. In recent months inflation has picked up moderately in the euro area; however, as this is mainly owed to a rise in energy prices, underlying inflation still persists at a low level. Monetary policy remains accommodative for growth in the euro area, and financing conditions in Finland continue to facilitate consumption and investment. Overall, Finland’s economic environment has the necessary fixtures for growth to continue, despite increased risks to the global economy. The forecast is based on data available as of 28.11.2018.
Global economy grows despite uncertainty
The near-term outlook for the global economy weakened slightly during autumn 2018. As it stands, the overall picture of the world economy is not completely uniform. In the United States, the economy continues to grow on a broad front, but in the euro area, Japan, and in China, growth has slowed (Chart 1). Economic growth in the euro area will continue throughout the forecast period, albeit at a pace closer to its long-term potential rate as the protracted cyclical expansion matures. Although various country- and industry-specific factors are expected to depress euro area growth in the short term, some of this may prove transitory. Despite the slowdown in economic growth, fixed investment in the euro area will keep growing. This will support demand for Finnish exports, as Finland’s primary export goods are capital and intermediate goods.
Global goods trade is growing despite slowing down in the beginning of 2018 (Chart 2). This means that while the global economy’s weakened outlook will slow development of Finland’s export markets, they will continue to grow nonetheless. Trade disputes and protectionism, in particular, increase uncertainty, as does concern about the sustainability of China’s economic growth. The performance of the global economy will support exports in the entire euro area, albeit less than before. In the euro area, the contribution of net exports to growth will remain near zero, and economic growth will mainly rest on domestic consumption.
Finland’s nominal effective exchange rate has appreciated since 2015. The nominal effective exchange rate is the trade-weighted average of nominal bilateral rates between the euro and the currencies of Finland’s trading partners. The appreciation of the effective exchange rate has, in part, weakened the competitiveness of Finnish exports. However, in 2018, this development — along with its detrimental effects on competitiveness — seems to have reversed to some extent.
chart 1.Global trade volume continues to grow
chart 2.Rising energy prices have accelerated inflation in the euro area
In recent months, inflation has picked up in the euro area (Chart 3) and in the other major economies. The rise in oil prices that continued throughout the year came to a halt in October. The price of oil has dropped from its peak of more than USD 85 down to about USD 60. In the long term, oil prices are expected to stay low, which will curb inflationary pressures during the forecast period. The price development of other industrial commodities is also expected be moderate, which has reduced short-term consumer price inflation pressures.
Underlying inflation in the euro area is still low (Chart 3). Euro area wages have risen slightly, and slowing productivity growth has raised unit labour costs somewhat. So far, the slight wage increase has not reflected markedly on consumer prices. The rise in producer and import prices is expected have a positive effect on underlying inflation.
chart 3.Average interest rate on new corporate-loans slightly higher than euro area average
Monetary policy supports growth in euro area
According to the forward guidance of the ECB, monetary policy in the euro area will remain accommodative and contribute to growth in 2019. The ECB expects its key policy rates to remain at their present levels at least through the summer of 2019.
The ECB has also announced (13 December 2018) that net purchases under the asset purchase programme will cease at the end of December 2018. The Governing Council intends to continue full reinvestment of principal payments from maturing securities for an extended period of time, well past the date when the Governing Council starts raising the key ECB interest rates, and in any case for as long as necessary to maintain favourable liquidity conditions and an ample degree of monetary accommodation.
Financing conditions favourable for consumption and investment
Financing conditions in Finland remained relaxed for both the private and public sectors, supporting consumption and investment. However, financing costs will slowly increase, as interest rates begin to rise. Household financing conditions are more relaxed than in the euro area on average (Chart 4). The average annualised agreed rate on new housing loans has followed the Euribor rates and declined for a long period of time. By contrast, the average annual interest rate on consumer credit has been on the rise since the end of 2016.
The interest rate on new loans for Finnish corporations, in turn, was slightly higher than in the euro area on average, even though the rates still remain low (Chart 5). According to the Business Tendency Survey by the Confederation of Finnish Industries EK, financing issues as an obstacle to production and sales have slightly increased during 2018, especially in construction. The survey results also show that financing issues have not markedly increased in manufacturing. In service companies, financing issues have become less common.
chart 4.Household consumption tracks income developments
chart 5.Housing company loans boosting household debt burden
Table 2. Key forecast assumptions
| Forecast assumptions | |||||
| 2017 | 2018 | 2019e | 2020e | 2021e | |
| Finland's export markets1, % change | 5.8 | 3.8 | 3.4 | 3.7 | 3.5 |
| Oil price, USD/barrel | 54.4 | 71.8 | 67.5 | 66.8 | 65.9 |
| Export prices of Finland's competitors, euro, % change | 3.0 | 0.9 | 3.7 | 2.3 | 2.2 |
| 3 month Euribor, % | –0.3 | –0.3 | –0.2 | 0.2 | 0.6 |
| Finnish 10-year sovereign bonds, % | 0.5 | 0.7 | 0.8 | 1.0 | 1.2 |
| Finland's nominal effective exchange rate2 | 95.6 | 92.2 | 92.1 | 92.1 | 92.1 |
| US dollar value of one euro | 1.1 | 1.2 | 1.1 | 1.1 | 1.1 |
| 1 The growth in Finland's export markets is the import growth in the countries Finland exports to, weighted by their average share of Finland's exports. | |||||
| 2 The exchange rate appreciates as the index falls. | |||||
| Sources: Statistics Finland and Bank of Finland. | |||||
Growth rests on domestic demand
The Finnish economy is still booming but growth momentum will slow towards the end of the forecast period (Chart 6). In 2018, GDP growth will reach 2.7%, but will be only 1.9% in 2019 and 1.7% in 2020. Finland will gradually transition from a boom towards the estimated long-term potential growth rate of the economy. Uncertainty surrounding global economic developments has increased and the moderation of euro area economic growth, in particular, will weaken the Finnish economic outlook.
Economic growth in the forecast period will rest mainly on domestic demand, as the pressures associated with the global outlook will affect Finland’s net exports. Growth in private investment will ease already in 2018 and residential construction investment, in particular, will decline with the maturing of the housing market cycle. Domestic demand will continue to be fuelled primarily by private consumption. Higher employment and earnings levels will boost household income throughout the forecast period. Domestic demand will also be buoyed by loose financing conditions.
The current forecast is based on Statistics Finland’s quarterly national accounts for the second quarter of 2018 and other information available on 28 November 2018.
chart 6.Export growth moderates
Growth in purchasing power supports consumption
In 2018 and 2019, private consumption will grow at an average rate of about 2% but the pace of growth will moderate towards the end of the forecast period. At the beginning of the forecast period, consumption will grow at a slower pace than disposable income. Even so, the household savings rate will remain negative throughout the forecast period (Chart 7).
The level of earnings will continue to rise during the forecast years. Average hourly earnings will rise by an average annual rate of 2.5%. Income received on pensions and benefits will also increase, once the freezing of index increments comes to an end after the year 2019. Taxation of earned income will be eased in 2019 but at the same time excise duties and employees’ pension contributions will rise. Overall, the tax changes will only have a marginal effect on the purchasing power in the forecast period. Instead, growth in purchasing power will be dampened by inflation, which will pick up towards the end of the forecast horizon, to stand at over 1.5%. Hence, the average annual growth in real earnings will remain at about 1% during the forecast years.
In 2018, disposable household income and purchasing power will be boosted particularly by a rapid improvement in employment. In 2018, the number of persons employed will increase by almost 2.5% from the previous year. With the maturing of the economic cycle, however, employment growth will gradually abate and in 2021 the number of persons employed will only grow at an annual rate of slightly less than 0.5%. Considering both wage developments and higher employment, disposable household income in 2018 will grow by about 3.5%, in real terms. Towards the end of the forecast period, the growth rate will fall to just under 1.5%.
In addition to favourable income developments, households’ financial margin will be bolstered by the low level of interest rates. Influenced by the favourable income developments and loose financing conditions, consumer confidence in their own financial position has remained good. Consequently, private consumption will continue to support economic growth during the forecast period.
Households’ net savings rate will remain negative during the forecast period, but less so than in 2016 and 2017 (Chart 7). The low level of interest rates has eased further debt accumulation by households. However, the interest rates are expected to rise gradually in the latter half of 2019. These expectations, together with the rapid growth in household income, may explain the rise in the household savings ratio. Households’ debt burden, however, will still remain high.
chart 7.Public sector will remain in deficit
Housing company loans boost household debt burden
The stock of housing-related loans will grow moderately in 2018, by about 2% on the previous year. More so than housing-related loans, however, household indebtedness is being fuelled by household ownership of housing company loans (Chart 8). Household debt relative to disposable income – the indebtedness ratio – is about 112%, excluding households’ estimated participations in housing company loans. Including housing company loans, the indebtedness ratio is approximately 129%. The estimate of households’ ownership shares in housing company loans is subject to uncertainty, however. The volume of housing company loans has increased especially as a result of brisk sales of new-build housing, as a larger share of sales has been financed via housing company loans. If growth in the stock of loans to household remains unchanged, households’ predicted income development will be insufficient to turn the indebtedness ratio on a downward path.
Sales of old dwellings have demonstrated weaker performance than sales of new homes. This notwithstanding, the prices of old dwellings have risen in growth centres, influenced by continued growth in migration to large cities. Net-emigration regions, in turn, are suffering from weak markets for old houses. There is no demand for new residential construction, either. Despite the continued migration to growth centres, housing markets are expected to cool off in an environment of slower economic growth. At the same time, private investment in residential construction will enter a downward trajectory, once the boom in new residential construction begins to lose momentum.
chart 8.Average earnings and labour costs
Investment growth abates
Private investment growth will abate in the forecast period. Investment will increase by 3.7% in 2018 and by 2.3% in 2019. Towards the end of the forecast period, the growth rate will be approximately 2% (Chart 9). However, in an environment of strong corporate profitability and favourable financing conditions, there is potential for private investment growth in the forecast period, although the uncertainties surrounding the economy may discourage corporate investment.
chart 9.Inflation still moderate
Growth in fixed investment of the non-financial corporations sector peaked in 2017, when private investment increased by 4.6% and total investment across the economy by 4.0%. Investment growth eased markedly already at the end of 2017, however, and fixed investment has remained fairly modest in 2018. Fixed investment will continue to grow during the forecast years, but more slowly on average than in 2016–2017. This may partly reflect one-off factors associated with the completion of certain large investment projects. In the forecast period, investment will be surrounded by an upside risk, however, provided that the planned industrial investments are realised on a broad scale.
The upward trend in construction is also reversing. In 2018, construction activity has still been strong, with new residential construction being been particularly buoyant. The number of residential building permits begun to decline already in summer 2018, however, resulting in a flattening out of the number of housing starts (Chart 10). In 2019, the number of both housing starts and completions will begin to decrease. Renovation building, in turn, is assessed to contribute to sustaining investment growth. Overall, based on building permits, total construction will be slowing down.
chart 10.Unemployment now below its structural level
The financing conditions of the non-financial corporations sector will remain favourable in an environment of accommodative monetary policy. In 2018, new drawdowns of corporate loans have grown more rapidly than in the previous year, while growth in the corporate sector loan stock has exceeded the euro area average. Funding bottlenecks in the main industries have increased markedly only in respect of construction. Firms consider that the availability of labour and capacity constraints are presently more dominant factors preventing growth than access to finance.
At the same time, corporate sector profitability has improved rapidly, although relative to value added it has not reached the pre-financial crisis level. In the National Accounts, operating surplus is equivalent to operating profits recorded in non-financial corporations’ financial statements. In 2017, the operating surplus from ordinary activities rose by 21%, compared with 5% on average in 2013–2016. The corporation sector surplus for 2017 totalled EUR 10.7 billion, further strengthening the sector’s net lender position that has prevailed throughout the 2000s.
Export growth has passed its cyclical peak
Export growth has rebounded in the past few years, supported by the booming global economy and improved cost competitiveness. Both goods and services exports have increased at a rapid pace, and the share of exports in GDP has also risen (Chart 11).
chart 11.Labour supply increasingly constrained
In 2017, the volume of exports was still growing at a rate of over 7%, growing faster than the export markets. However, export growth has already passed its cyclical peak. In 2018, export growth will slow to a good 3% and will fall somewhat behind export market growth. In 2019–2021, export growth will slow further, but will remain close to 3%. The contribution of net exports to growth will contract noticeably in 2018, but will remain positive throughout the forecast period.
Above all, growth in Finland’s export markets will be dampened by increasing uncertainties surrounding the global economic developments and a weaker outlook for the euro area growth. Increasing uncertainties and the threat of an escalation of the trade war, in particular, are easily reflected in corporate expectations and therefore also in the investment outlook for Finland’s trading partners. Weaker investment demand, in turn, is easily reflected in Finnish exports, which consist mainly of capital and intermediate goods.
Finland’s export industries have managed to increase their market shares in the past few years, partly as a result of better cost competitiveness. However, unit labour costs will rise during the forecast period, increasing the risk of a deterioration in export industries’ cost competitiveness.
The sufficiency of production capacity in the export industry sector is also threatening to become a bottleneck for export growth. Capacity utilisation in the manufacturing sector is high, and in some industries, such as automotive and ICT manufacturing, the availability of labour is already causing problems. Productivity growth has slowed, too (see Slow productivity growth hinders export growth).
Because of the import inputs in domestic demand and exports, imports will also grow in the forecast period. However, import growth will abate faster than export growth. Export growth will be weakened over the forecast years by slower growth in investment and consumption.
Finland’s current account, which has long remained in deficit, will therefore move closer to balance. The deficit has persisted due to the indebtedness of both households and the public sector and the fact that the surplus on the corporate sector has been insufficient to offset this trend (Chart 12). Growth in household and public-sector indebtedness is slowing, however. The trade surplus will strengthen towards the end of the forecast period, influenced by a faster growth in the value of goods and services exports than in imports.
chart 12.Growth in potential output sluggish
Public finances remain in deficit
Finland’s general government finances have been strengthened by economic growth, higher employment, fiscal consolidation and lower unemployment. Despite these favourable factors, the downward trend in the general government deficit will come to a halt in 2018, and a balanced budgetary position will not be attained in the forecast period 2018–2021 (Chart 13).1 The central and local government primary balance2 will remain negative throughout the forecast period.
The general government debt-to-GDP ratio will fall below 60% in 2018 and the downward trend will continue throughout the forecast period. This means that Finland will fulfil the requirements for deficit and debt stipulated in the EU Treaty. Living on debt will continue, however, and the euro volume of public debt will continue to grow further also in 2021. The total tax ratio will decline to 42%, after having been 44% in 2016.
chart 13.Uncertainty in the global economy
Public consumption expenditure will grow in 2018, fuelled by fixed-term key projects, statutory and contractual pay increases and a one-off wage increase for compensating holiday pay cuts. However, real growth in public consumption will moderate in 2019–2021 on the back of the Government’s adjustment measures and conclusion of general government key projects. Public investment will also grow in 2018, but will contract in the following year with the conclusion of the key projects. Public investment will continue to grow at a slow pace in 2020–2021.
Tax revenue growth will pick up to 3% in 2020–2021, reflecting higher revenues from direct and indirect taxes alike. Increases in excise duties will continue in 2019, and so will the gradual reduction of the deductibility of mortgage interest expenditure. Vehicle taxes, in turn, will be lowered. The taxation on earned income will be eased to compensate for the effects of the Competitiveness Pact and the rise in the earnings level.
The central government deficit will decline to 0.5% relative to GDP by 2021.3 Even though the central government primary balance will turn positive in 2020, the government finances will continue to post a deficit due to interest expenditure on public debt. Central government expenditure will grow in 2018–2019 mainly on account of wage increases and rising pension expenditure. On the other hand, adjustment measures related to the central government budget, lower expenditure on immigration and unemployment benefits as well as zero index increments will lower general government expenditure. The early repayment of the loan of EUR 1.4 billion granted by the state to the Finnish Export Credit will reduce the need for general government borrowing.
The downward trend in the local government deficit will come to a halt in 2018 and the deficit will deepen to around 0.5% relative to GDP in 2019–2021. Central government transfers to local government will grow slowly in 2018–2019 and will be restrained by the Competitiveness Pact and an adjustment of the division of costs between central and local government. The measures to reduce municipal tasks will push down both local government expenditure and central government transfers to the sector.
The surplus on the earnings-related pension funds has declined in recent years, as pension expenditure has grown at the same time with modest growth in property income and pension contributions. The annual growth in pension benefits paid will pick up to over 4% in 2020–2021 and will continue to surpass growth in income received by earnings-related pension funds. Other social security funds will still continue to post a fairly strong surplus in 2018, when social benefits other than social transfers in kind will decrease by almost 4%, particularly due to lower expenditure on unemployment benefits. The sum of these benefits will not begin to grow until 2021.
Economic growth constrained by supply-side factors
Economic growth will be constrained by supply-side factors during the forecast period due to the favourable cyclical conditions of recent years as well as longer-term structural factors. Solid employment growth and subdued investment growth in 2018 will reflect on the availability of labour and adequacy of capacity. Output will exceed its potential level in the forecast period. Productivity growth will remain below its historical trend.
Structural unemployment remains high
Employment grew strongly in 2018 and the unemployment rate declined by one percentage point on the previous year. Employment growth has been exceptionally brisk relative to the rate at which the economy has grown, but during the forecast period, employment growth will slow significantly. In 2018–2021, the number of persons employed will increase by nearly 100,000 – the bulk of which in 2018. The unemployment rate will decline to 7.0% during the forecast period (Chart 14).
chart 14.Global trade volume continues to grow
The exceptionally strong development of employment relative to economic growth in 2018 might partly be explained by structural reforms in the labour market, which may have expanded the scope for employment growth. In addition, the considerably slower rise of labour costs relative to productivity growth may have created conditions conductive to employment growth.
Recent measures affecting labour market structures include restrictions on the maximum duration of unemployment allowance and a new activation model. These policies have, through various means, reduced the attractiveness of unemployment relative to working. Similar effects have already been achieved with cuts to benefits linked to the national pension index in 2016 and 2017, the pension reform in 2017, and in 2014 the introduction of a sum of exempt earnings under unemployment allowance. Overall, incentives to work have improved in the past couple of years by 2.5–3%, measured by the average participation tax rate.4 Demand for labour, in turn, has been supported by the Competitiveness Pact, which resulted in a decline in labour costs.
The slow development of labour costs, as well as the structural reforms which have strengthened the incentives to work, may continue to bear fruit in the years ahead. An increase in unfilled vacancies, and employment expectations in the corporate sector, indicate that employment developments will remain favourable in the immediate future. In 2019, employment will continue to grow, by just under 1%.
Labour market conditions have tightened further, as for every unfilled vacancy there are fewer available unemployed jobseekers. Labour shortages are, according to corporate surveys, becoming a growing obstacle for raising production. Many indicators support the view that matching has become less efficient on labour markets following the long recession as well as structural changes. Mismatch problems may be underpinned by a high share of the long-term unemployed, a growing share of aging jobseekers, and plentiful demand for highly educated workers but insufficient supply. The decline of the working-age population will also, for its part, constrain employment growth during the forecast period.
Structural unemployment, or the unemployment rate purged of its cyclical component, is estimated to still remain high, at a level of about 8%, which suggests that the recent decline in unemployment has been due to cyclical factors (Chart 15). The high estimated level of structural employment supports the view that labour markets continue to face substantial capacity constraints.
chart 15.Financing conditions for households have remained relaxed
The exceptionally rapid growth in employment witnessed in 2018 will thus remain a temporary phenomenon, as the effects of structural reforms in the labour market fade and employment growth is slowed by the persistently high degree of structural unemployment, labour market mismatches and a decline in the working-age population. Employment growth will slow to below 0.5% in 2020 and 2021.
The employment rate will continue to improve during the forecast period. This will be influenced both by an absolute increase in the number of employed persons as well as by the proportional decline of the working-age population. The employment rate will reach the target level of 72% and will climb to slightly under 73% in 2021, the last year of the of the forecast period.
With economic growth moderating, labour demand will begin to contribute to a loosening of labour market conditions and prevent the formation of wage pressures. Towards the end of the forecast period, wage growth will equal the combined growth rate of productivity and prices. The risk is that as growth remains solid and labour market conditions tight, the Competitiveness pact’s moderating effects on wage growth will be offset in the next round of wage negotiations by demands for wage rises clearly above productivity growth. Wage growth might prove faster than predicted and employment growth respectively slower. In this scenario, the Competitiveness Pact’s positive impact on employment would remain temporary.
Capacity utilisation rate is high
Growth constraints have increased, as a result of the upswing that has been ongoing for some time. As employment has rapidly improved during the past year, the capital stock has not kept up with the growth in labour. An increase in the number of firms who estimate that capacity is adequate or too little is suggestive of the growing presence of capacity constraints. The capacity utilisation rate in manufacturing has reached a high level but is still below the peak reached in the previous boom (Chart 16).
The slowing of fixed capital investment (excluding residential investment) beginning in late 2017 and continuing for the entirety of the past year suggests that capacity constraints will persist in the beginning of the forecast period, even though subdued investment growth may be owed to the transition of economic growth towards services. The moderation of the economy will ease capacity constraints towards the end of the forecast period.
chart 16.Economic growth rests primarily on domestic demand
Availability of labour is an increasingly large problem. Companies are reporting increasing difficulties in recruiting skilled labour in all the main sectors (Chart 17). These issues are estimated to be the largest in finding skilled labour for building; however, the moderation of construction promises to ease the shortage of skilled labour in the industry. In services, the shortage of labour is already larger than during the previous cyclical peak. This issue may be set to continue, as for example demand for social- and healthcare workers does not fall even when the business cycle decelerates.
chart 17.Housing company loans boosting household debt burden
Output gap is positive
Although GDP growth has passed its cyclical peak, the economy is set to continue in a subdued boom phase. GDP has increased briskly over the past few years, resulting in output growth exceeding its potential rate5 and the output gap finally closing. In the forecast period, the output gap will remain slightly positive, i.e. GDP will be higher than potential output. (Chart 18).
The output gap remained negative both in Finland and in the euro area for an exceptionally long period during the double-dip recession which followed the financial crisis, meaning that economic resources were being underutilised. As economic conditions have lifted, the capacity utilisation rate and employment have also gained strength. As it stands, less economic slack is available for raising production than before. Yet although positive, the output gap will remain moderate, as the decline of growth in global demand, which is central for the Finnish economy, weighs on economic growth.
chart 18.Upward trend in residential construction reversing
Growth in potential output is significantly slower than before the financial crisis (Chart 19). Total factor productivity has strengthened after the protracted downturn, but it is nevertheless far below record years. In 2018–2021, an increase in investment will boost the capital stock and strengthen potential output. Towards the end of the forecast period, the importance of labour as a source of potential output may fade. The supply of labour is restrained by the decline in working age population (15–74-year-olds) and the high rate of structural unemployment.
chart 19.Current account moving closer to balance
Following a protracted downturn, labour productivity returned in 2016–2017 to a growth rate of some 2%. The rapid improvement will however remain cyclical, i.e. temporary. Productivity growth in 2018 was slow, partly reflecting the exceptionally rapid growth in employment (Several reasons behind weak labour productivity). Going forward, employment and productivity are expected to provide more balanced support to economic growth. In 2018–2021, the pace of labour productivity growth will be slow, on average 2%. The higher capital intensity of the economy will however improve labour productivity slightly, reflecting the larger amount of capital available per hours worked (Chart 20).
Labour productivity growth is set to remain considerably slower than at the beginning of the 2000s, when the annual growth rate averaged 2.5%. The slowdown in productivity growth can be explained e.g. by the smaller weight of high-productivity industries and increased importance of services in the economy, a shift in investment from machinery and equipment to housing as well as a contraction in the share of R&D investment. For example, despite continued passable growth in machinery and equipment investment, the growth rate will remain close to the lowest figures recorded in the 2000s relative to GDP. Slower productivity growth may also be due to changes in the structure of the corporate sector (Divergence of productivity growth in Finnish companies).
chart 20.Producer price indices
Inflation gathering pace gradually
Consumer price inflation has picked up in the past year; however, inflation has thus far been fuelled by transitory factors, i.e. rises in energy and food prices. In the forecast period, a moderate pick-up in inflation will be supported by faster nominal wage growth than in recent years.
Transitory growth in external price pressures
The price of oil has risen sharply from the very start of 2018, but has now returned to levels seen early on in the year. Price volatility has been stoked by geopolitical factors. In addition to the oil price, wholesale prices of electricity have also risen strongly, but they too have retreated from their heights reached in summer 2018.
Developments in the import prices of consumer and capital goods have been moderate (Chart 21). An increase in external inflationary pressures has been backed only by price gains in intermediate goods and energy. Their upward development has already halted and reversed partially, so the external price pressures are currently very moderate.
chart 21.Finland's cost-competitiveness relative to the euro area
Labour costs rising
Growth in nominal earnings started to accelerate towards the end of 2017, as the new collective agreements entered into force (Chart 22). As a result of the measures included in the Competitiveness Pact, growth in earnings remained very slow and compensation per employee, which includes employers’ social security contributions, decreased by 1.2%. At the same time, economic growth picked up and productivity grew by 1.6%, resulting in unit labour costs declining significantly.
chart 22.Employment growth will slow
During the forecast period, growth in earnings will depend largely on the collective agreements concluded for 2018–2019, according to which negotiated wages will rise by on average 1.6% in 2018 and 2019. In the economy as a whole and taking into account wage drift, growth in nominal earnings will be just under 2% in 2018 and nearly 2.5% in 2019, according to the index of wage and salary earnings. The temporary cuts in public sector holiday bonuses, included in the Competitiveness Pact, will end in 2020 and will accelerate the pace of growth in wages. During the forecast period, nominal earnings, measured by average hourly wages based on the wage bill, will grow by 2.5% on average, per annum. Average labour cost (compensation per employee) will grow in 2018 and 2019 at a more moderate pace than average earnings, due to the reductions in employers’ social security contributions. Towards the end of the forecast period, growth in unit labour costs will accelerate, reflecting higher wages and increases in employers’ social security contributions.
In 2018 and 2019, unit labour costs will grow by just under 1% per annum, i.e. at a slightly slower pace than in the euro area, thus allowing for continued improvement in cost-competitiveness (Chart 23). The next round of wage negotiations should start before summer 2019. The forecast is based on the technical assumption that the pace of growth in real wages in 2020 and 2021 will be broadly the same as growth in productivity. Growth in unit labour costs will accelerate to around 1.5%, which is in line with unit labour cost growth in the euro area, and will thus sustain the improvement in Finland's cost competitiveness in recent years relative to the euro area. If economic growth remains strong and the labour market is still tight when the next round of negotiations starts, there is a risk that pay rises will be higher than productivity growth and that cost-competitiveness will weaken.
chart 23.Small amount of economic slack
Inflation still moderate
In 2018, inflation has been fuelled particularly by hikes in energy and food prices as well as increases in indirect taxes. Inflation according to the harmonised index of consumer prices (HICP inflation) was 1.4% in November. Underlying inflation at constant tax rates (excl. energy and unprocessed food) was however only 0.4%. Inflation has been fuelled by transitory factors. Services inflation has remained moderate, and inflation has been slowed especially by the weak price development of manufactured goods.
Despite the still subdued pace of underlying inflation, price pressures in the economy have strengthened, supporting the moderate pick-up in inflation. Producer prices of services have risen, to 1.7%. In the past year, producer prices of consumer goods have not declined, in contrast to previous years. A key factor contributing to the subdued pace of inflation in recent years is the moderate development of wages. The acceleration in wage growth is reflected in the projections for consumer prices. Inflation is expected to be 1.3% in 2019 and to pick up to 1.7% in 2021 (Chart 24).
chart 24.Output gap is positive
Growing concern over the global economy
The forecast risks are predominantly on the downside. Uncertainty has gathered over the global economy during the year. Domestic downside risks to the economy have similarly increased recently.
The global economic outlook has dimmed over the course of the year, as has the growth outlook for the euro area. Concerns about the tenability of the sustained upswing have increased, clouding the prospects for Finnish exports as well. In particular, the threat of an escalating trade war has undermined confidence and could hamper investment. Challenges faced by emerging markets have also increased. Currency depreciations have restricted imports in many emerging-market economies. An unexpectedly rapid deceleration of China’s growth rate, which has been fuelled by debt, may result in a significant decline in investment growth.
Increasing barriers to trade may engender unpredictable effects on world trade and international trade flows due to the complexity of global supply chains. Finnish export market growth is vulnerable to the threat of trade war especially because Finnish exports mainly comprise investment goods and services. Rising uncertainty alone can postpone investment activity far into the future.
In addition to rising protectionism, Finland's trade prospects are impacted by uncertainty over the terms of the United Kingdom’s withdrawal from the EU. The enforcement of trade barriers between the United Kingdom and European Union will weaken the development of Finnish export markets and raise prices on imports and exports. Finnish firms would face greater travails in exporting to the United Kingdom and the prices of their export products would increase.
The outlook for the Italian economy has weakened, and uncertainty has mounted over the direction of the country’s economic policy. Italy’s non-compliance with EU fiscal rules and its significant level of public debt have eroded confidence in the euro area. The resulting loss of investor confidence has raised yields on Italian sovereign bonds far above levels seen in the beginning of May. A further weakening of the confidence climate would amplify uncertainties about euro area growth and reflect on the development of Finland’s export markets.
The recent appreciation of the euro, coupled with a rapid increase in the pricing of Finnish exports, could weaken the price-competitiveness of exports outside the euro area. A loss of price-competitiveness against competing export countries might slash export growth more than predicted.
China has become an increasingly important consumer of Finnish exports in recent years, and the prospects of Finland’s exports are more dependent on Chinese growth than ever before. The greatest risks to economic growth in China are related to its growing indebtedness. Should the risks associated with the country’s debt-fuelled growth materialise and funding run dry, Chinese investment and GDP growth will falter. The trade war with the United States may exacerbate China's situation even further.
Domestic risks lean slightly towards the more favourable, compared with external risk factors. Fixed investment growth may pick up quicker than forecast in the years ahead, if investments in the forest and energy industries proceed as planned. Should these investments materialise, fixed investment will grow faster than the forecast baseline. Similarly, implemented investments and those still under planning in recent years may raise productivity and exports above the forecast baseline. On the other hand, the business cycle propelling new-build construction on the housing market may mature more sharply than forecast.
A significant source of uncertainty is the development of wage growth and cost-competitiveness over the immediate years ahead. In the baseline scenario, Finnish export growth is expected to underperform the expansion of Finland's’ export markets. However, if wage growth persists at a lower level than in competing export countries, the resulting gains in cost-competitiveness could help Finnish export industries reclaim their lost market shares.
Incomes may yet rise faster than expected. Slow wage growth in recent years, owing to the Competitiveness Pact among other factors, may lead to higher compensation demands in the years ahead. Bigger wage rises would result in higher unit labour costs and a weakening of competitiveness.
In 2018, the number of employed grew exceptionally quickly, but employment growth is expected to moderate significantly in 2019. If the reforms of recent years that better incentivise employment continue to bear fruit in the years ahead, employment growth may be higher than the forecast baseline. Structural employment may abate, allowing for more room for economic and employment growth without contributing to wage pressures.
Private consumption has in recent years supported economic growth in spite of cyclical conditions and growing household indebtedness. Stronger employment growth, wage rises and low inflation have strengthened households’ purchasing power and might spur private consumption more than forecast.
The development of private consumption is however clouded by growing household indebtedness. A rise in interest rates, coupled with a high debt burden, will impact domestic demand, and private consumption may decelerate faster than estimated. In addition to housing-related loans, indebtedness is being fuelled by rapid growth in consumer credit and households’ shares of housing corporation loans. Rising household indebtedness increases the aggregate economy’s sensitivity to the business cycle and also obfuscates development of the housing market.
Realisation of global economic risks would adjust forecast downwards
Uncertainty over the development of the world economy has increased over the past year, and risks stemming from the external environment are on the downside (see Growing concern of the global economy). If these risks materialise, Finnish export and GDP growth will both underperform the forecast baseline. The uncertainty in the forecast is best illustrated by a fan chart. The fan charts (Charts 25 and 26) illustrate the forecast uncertainty related to external factors and provide an assessment of asymmetrical risk factors.
chart 25.Uncertainty in the global economy
chart 26.Realisation of global economic risks would adjust forecast downwards
Annual export market growth displays a spread of about -3% to 8% around the baseline6 during the forecast years 2018–2021 (Chart 25). The asymmetry of the distribution is indicative that the risks to export market growth are predominantly on the downside and not the positive. Downside global risk factors include a rise in protectionist policy measures, deceleration of growth in the Chinese economy, and the debt burden of Italy's general government.
Price developments in export markets, in turn, fluctuate around the baseline forecast by about 0% to 5%. The uncertainty surrounding price development is thus less asymmetrical than the uncertainty concerning growth of export demand. For example, many protectionist policy measures, such as tariffs, have immediate price-raising effects. On the other hand, subdued world trade growth would weaken demand and thus mitigate upward pricing pressures.
To assess how sensitive the development of the Finnish economy is to uncertainties stemming from the external environment, the forecast can be conditioned on the paths for export market growth and price development as seen in the fan charts. Using the standard forecast assumption as baseline, export growth displays a spread of -3% to 8% over the forecast period 2018–2021 (Chart 26). The alternative forecast paths for exports are tilted to the downside compared with the baseline and thus are indicative of the risks to export growth. GDP growth fluctuates between 0% and 3% during the forecast period. As in the distribution for exports, it is tilted to the downside compared with the baseline forecast.
Based on the estimate, a realisation of global risk factors would dampen Finnish growth over the forecast period, most particularly in exports. A complete cessation of GDP growth would however require export markets to contract for several years. In light of the estimate, the probability of this occurring, thus halting economic growth in the forecast period, is very small.
Notes
-
The forecast for the public sector for 2020–2021 is based on the no-policy-change assumption, except for the discretionary changes already known for 2020–2021. The fiscal policy plans of the Government to be formed after the spring 2019 parliamentary elections will be taken into account in the forthcoming forecasts. ↑
-
Budget balance net of interest payments. ↑
-
This Bank of Finland forecast does not take into account the sectoral changes in the central and local government subsectors stemming from the social and health care reform. ↑
-
Kärkkäinen and Tervola (2018): "Talouspolitiikan vaikutukset tuloeroihin ja työllisyyteen 2015–2018", Valtioneuvoston selvitys- ja tutkimustoiminnan julkaisusarja 59/2018. Finnish only. ↑
-
Potential output is the level of real GDP when all the economy’s factors of production are fully utilized. ↑
-
The Bank of Finland's December 2018 forecast. ↑